In the last post [
STAR*D lives…], I discussed three articles covering the same subjects from a study [
STAR*D] done between 2001 and 2004. Why did we need three versions since the data was available for several years before the first study? I don’t know the answer to that question, but it is a pattern observed widely in
STAR*D – a hundred or more papers. But there are other things to note besides the glut of articles. The primary efficacy variable chosen for this study was the
HAM-D rating scale – widely used in studies of depression. In spite of this, the most definitive paper about this study [
Acute and Longer-Term Outcomes in Depressed Outpatients Requiring One or Several Treatment Steps: A STAR*D Report] used another scale [QIDS] developed by the authors. And in spite of their own promise to publish the results of the primary efficacy variable and numerous request for those results by others, that data is unavailable. These three articles I’m talking about here
all rely on the HAM-D Scale. That data is obviously available to the
STAR*D group and freely published in these "aside" studies. Why won’t they publish them for the main act? Even if the HAM-D doesn’t support their preferred conclusions, that was an
N.I.M.H. study that cost a mint. It’s our right to see the outcome, no matter what it was. There are a number of challenges to the QIDS results that were published that could be cleared up by releasing the whole data set. To my knowledge, the
N.I.M.H. has not pressed the authors on this omission. That’s unacceptable.
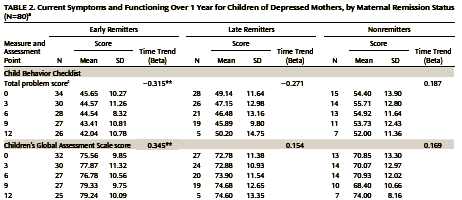
Now back to the last of the three studies analyzing and reanalyzing the children of depressed mothers [Children of depressed mothers 1 year after remission of maternal depression: findings from the STAR*D-Child study]. In that study, the mothers were divided into three groups: Early Remission [HAM-D < 7 by 3 months]; Late Remission [HAM-D < 7 between 3 months and 1 year]; and Non-Remission [HAM-D < 7 at one year]. The children’s course was followed at 3 month intervals for 1 year after the mother’s remission or 1 year – whichever came first. They followed: both child an mother reported symptom lists; a Problem scale with Total, Externalizing , and Internalizing Problems; and a Child Global Functioning Scale. Because this paper is not online, I’ve included the Total Problem and Global Functioning Data [as exemplary] below. I’ve also added their explanation of the statistical analysis.

Data Analysis: The relation of maternal remission status to child outcome in the year following remission was assessed with Poisson regression analysis when the outcome was the number of childsymptoms at each time point, and was assessed with longitudinal mixed-effects regression when the child outcome was a continuous variable, such as the Children’s Global Assessment Scale or Child Behavior Checklist score. Maternal remission status (early, late, or nonremitting) was included in the models as a three-level categorical predictor variable. All regressions were conducted within a generalized estimating equations framework to adjust for correlations between repeated observations over time. The Poisson regressions used an exchangeable correlation matrix, and the longitudinal mixed-effects regressions used an unstructured covariance matrix. We performed analyses using PROC GENMOD (for Poisson regression) and PROC MIXED (for linear regressions using longitudinal mixed-effects analysis) in SAS, version 9 (SAS Institute, Cary, N.C.). For all of the models described above, we included the following potential confounding variables in the analyses: child’s age and gender; household income; mother’s baseline HAM-D score, presence of an anxiety disorder or substance use disorder at baseline, and marital status; child’s treatment status over the course of the study (any versus no treatment); and child’s baseline score for the outcome under consideration. An interaction term representing time by maternal remission status was included in the regression analyses to formally test whether the rate of change in child symptom outcomes varied according to maternal remission status. Missing outcome data were handled by initially assuming that the data were missing at random for the continuous variables analyzed using mixed-effects models, and missing completely at random when using Poisson regression analysis using generalized estimating equations. Under this assumption, valid analyses can be conducted using models such as the mixed-effects mod-els based on maximum likelihood inference. Because of the large number of dropouts at the 12-month assessment in the late remission category, we performed a sensitivity analysis by rerunning all models after deleting the 12-month assessment for all participants and comparing patterns of change as represented by the beta coefficients for the 9-month period after maternal remission, and comparing results. Data on household income were missing for three mothers, and the average household income of all mothers in each maternal remission category was imputed.
I don’t understand the data analysis explanation enough to comment on it. There was a time when I was statistically more savvy and might have understood more than I do now, but my point is that even if I did understand [or you do], there’s not enough data included in the published paper to allow for evaluating either the validity of this methodology or its results. We have no choice but to accept the reported significances on blind faith.
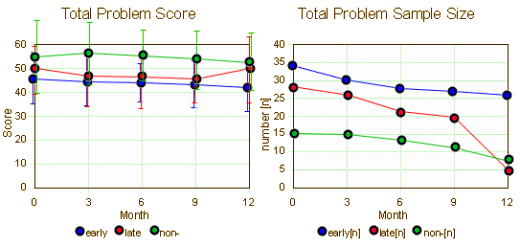
In the earlier paper, the data was displayed in graphs of the usual type. In this one, we got a table [partially reproduced above]. I’m suspicious when long tables are used when a graphic format would be easier, and since I was already put off by the erudite but impenetrable data analysis write-up, I thought I’d just make a few of the missing graphs to see what they looked like [I was suspicious of another significant but trivial example]:

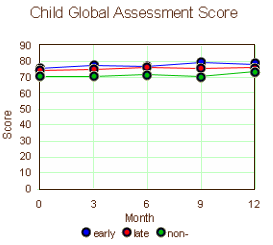
This is the longitudinal data on the kids beginning with either the time of maternal remission or 1 year of treatment without remission [mean and one standard deviation above and below]. We are asked to believe that the improvement in the early remission group [left graph, blue] is important. I’m underwhelmed. Frankly, I’d throw out the 12 month late remission value [so many drop-outs, right graph, red]. So the early/late responses then seem the same. And when I graph the Children’s Global Improvement, I’m beyond underwhelmed:

If the point of the multiple publication of this same study was to get me or other clinicians to be aware that maternal depression has an impact on their children, they didn’t need to bother. No person who has done any psychotherapy with adults would doubt for a second that maternal depression takes its toll – our patients have told us about it for years. But my suspicion is that these papers have another point. By the time STAR*D came along, the newer antidepressants had been around for a while and the disappointment in the results was growing. Drs. Rush, Trivedi, and others were out to convince us that it wasn’t the drugs that were not as effective as we wished, it was that we just weren’t pushing them hard enough, or dosing them high enough, or treating people long enough, or weren’t changing drugs often enough, or weren’t adding other drugs enough. That was the whole agenda of STAR*D, CO-MED, TMAP, or the other algorithmic strategies. So I think this study was designed to prove that treating the mothers helped the kids, emphasizing their "vigorous treatment" meme.
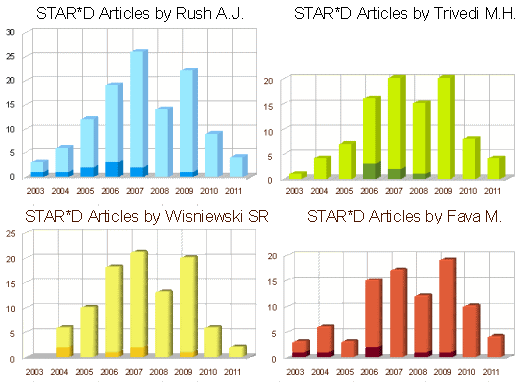
If you look at the increasingly indefinite conclusions from the papers, they started with a full court press and ended in the range of wimpy. The data didn’t support their conclusion [which kind of surprised me]. But one point I want to make is that STAR*D, CO-MED, TMAP, and the other algorithmic strategies were based on a pharmaceutical industry agenda, "Use more of our great antidepressants!" Their antidepressants are useful, but nowhere near the wonder drugs of the ads [or our literature]. There was another agenda – resume inflation [this graph was previously compiled from pubMed]:

All four of these authors are on all three of these articles. And all three of these articles are about the same patients and could’ve easily been covered in a single paper. Instead we have three different articles in primo journals over a five year span.
My own conclusion is that the hypothesis that "vigorous treatment" with antidepressants will vindicate their limited usefulness has been adequately disproven by the failures of STAR*D, CO-MED, TMAP, and the other algorithmic strategies. My second conclusion is that like many STAR*D papers, these three were specifically presented deceitfully. My third conclusion is that the publication of resume fillers has choked some of our best journals and decreased their usefulness [and stature]. My final conclusion – enough with the STAR*D re-runs already!


I’ve spent ~35 years of my life watching nearly all of my friends, myself included, be experimented upon by doctors who pushed SSRIs (and now SSNRIs) as if they were the new aspirin. Can’t sleep? SSRI. In pain? SSRI. Depressed? SSRI, of course. Anxious? SSRI. In short, its snake oil. I’ve seen them turn perfectly lively people into chemozombies and I’ve seen only the listed side effects in myself with NONE of the advertised effects. So why are they so reluctant to move on to drugs that may actually work: DRIs/partial reuptake inhibitors? Cannabinoids? Etc. IF you want to play with my 5HT, I’ll be happy to take you out in the woods and introduce you to God via an agonist (I do have connections to the Native American Church). Otherwise, try to touch my receptors and you’ll be coming through my scalpel to do it.