|
"…this research provides a powerful message that clinicians can give to families: adolescents with depression have abnormal neural circuitry, and treatment with fluoxetine will make the circuitry normal again."
"Mapping out these biomarkers will be the key to enabling the clinical advancements needed to allow patients to achieve remission in the earliest phase of illness, bringing adolescents back on course for healthy development and thus circumventing a host of potential negative consequences over their lifetime." |
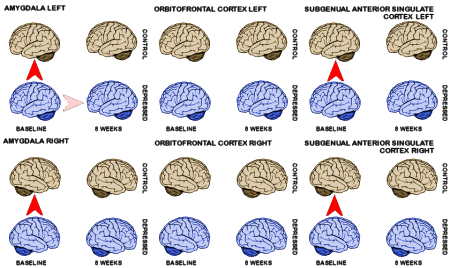
I’m a visual person. I really couldn’t follow the word descriptions of the findings in this study [Brain Activity in Adolescent Major Depressive Disorder Before and After Fluoxetine Treatment]. And to be honest, I don’t think any neuroimaging naive person could follow this study well enough to evaluate the findings. There’s a Data Supplement with the online version that focuses on the three areas of interest: The Amygdala, the Orbitofrontal Cortex, and the Subgenual Anterior Singulate Cortex. It summarizes the differences they found giving p values. In a study like this, there’s an important step – correcting the p value for the number of measurements. In this case, they used something called the False Discovery Rate [Altostratta pointed us to a very clear description of the question of correction in neuroimaging studies on Daniel Bor’s site]. This figure shows the comparisons that survived the correction and achieved significance [p<0.05].

[from Table S1]
What it says is that the baseline Amygdala and Subgenual Anterior Singulate Cortex areas were significantly more activated than the controls at baseline, but not after 8 weeks of Prozac. However, the difference between the depressed group at 8 weeks was not significant [the lighter arrow indicates "almost" significant p=0.058]. That’s, of course, a little problematic for their notion of Prozac reversing a circuit abnormality.
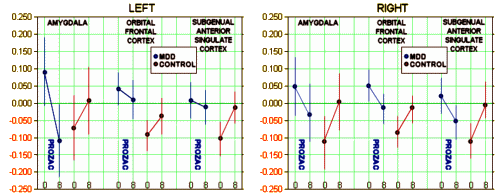
The Data Supplement had a second table ["TABLE S2. Group-by-Time Post Hoc Simple Group Effects for Amygdala, Orbitofrontal Cortex, and Subgenual Anterior Cingulate Activations"]. The units were "Signal Change (%)" which was also shown as a graph in the article. It showed the Mean and Standard Error at baseline by Group [MDD, Control] by Time [baseline and 8 weeks]. During the interim, the MDD Group was on Prozac with a 60% response rate [by CDRS-R]. Warning! This next paragraph is confusing [sorry].
Their table [S2] and Graphs compared MDD and Control at zero, side-by-side, then below that, the MDD and Control at 8 week values for each area and each side of the brain. Their p value did the same, MDD vs Control at zero then MDD and Control at 8 weeks. All of the baseline comparisons were significant. None of the 8 week comparisons were significant. They concluded therefore that the Prozac treatment normalized things in the brain. I told you it was confusing. I re-graphed it [because I couldn’t follow their graphs]. Here’s my version [mean and 95% confidence limits]:

I believe the "Signal Change (%)" to be a difference between scary and neutral faces. When I look at my graphs, it doesn’t make a lot of sense either. The two months on Prozac uniformly drops the "Signal Change (%)." But look at the controls [red]. They weren’t on anything. They were just being healthy controls living their lives. And their "Signal Change (%)" came up to meet the MDD group who were on Prozac.
I conclude two things from this. First, the response of the Control group really makes absolutely no sense – ergo, something was bad wrong. Second, there’s a missing group! an essential group! MDD on Placebo. Comparing responses to wandering controls just won’t do. The lack of significance might as well be explained by the changes in the Controls [whatever that means] as by the MDD/Prozac group [or both].
The “response”, which is of similar magnitude in the MDD and control groups, is probably a “test-retest” effect: less activation when the task is done for the second time, and the novelty is gone.
So a person who had no reaction to pictures of fearful faces is healthiest of all? People who react a lot to pictures of fearful faces must have an improperly functioning neurobiology? Could more and less associations with seeing fearful faces account for the differences?
The odd % signal changes may come from the nature of that metric. In fMRI you cannot directly get a % signal change – it is an inferred value calculated from the statistical results of your analysis and based on a number of assumptions (involving levels of noise in the signal and suchlike). I would be extremely hesitant to say that these assumptions are met where one is comparing two different scan sessions as this study does and would at least ask for some evidence that they are before allowing publication.
Even within one scan session, does an apparent signal change of 0% in the amygdala to fearful faces seem plausible? At the very least it would have made me suspicious were I reviewing the paper. Not that the underlying results that they get are invalid, necessarily, just that they are doing their analysis by the numbers, so to speak, rather than really getting into their data and methodology. fMRI is complex, but the software tools available mean that any idiot can get some results out by just pressing a few buttons – the skill is in getting results that actually mean something.
Moving to a slightly wider point, this sort of thing could be an effect of society’s strange belief that physicians are good people to ask to do research. There are many physicians that do excellent work, certainly, but the number that do pretty awful work is, in my experience, rather high. That’s understandable though – research isn’t generally their primary job, they generally aren’t trained to do it, and their time pressures mean that they can’t spend as much time as is necessary learning the boring but essential theory that underlies the tools that they use. Maybe I’m just biased though…
NWD
I’m a physician and I share your bias. The more I read about fMRI, the more obvious it is that it’s not for rookies or casual users. Thanks for your comment…
I posted a question about this study on Dr. Daniel Bor’s web site and received a very useful comment from Dr. Frederico Turkheimer, which was really helpful [see April 9, 2012 @ 5:09 PM UTC]. If you have any interest in this topic, take a look at his take on this paper.
And there’s even more to fMRI — see http://neuroskeptic.blogspot.com/2012/03/3d-fmri-promises-deeper-neuroscience.html
All the data gathered so far may be so superficial as to be invalid.
Excuse me, wrong link. Here’s the one I meant: http://neuroskeptic.blogspot.co.uk/2012/03/brain-scanning-just-tip-of-iceberg.html