Almost everyone knows what a p value is – how probable is it that a difference is real and not just a sampling error? And we know p < 0.05 is good enough; p < 0.01 is real good; and p < 0.001 is great. In this case, the outcome variable was the CDRS-R [Child Depression Rating Scale – Revised]. Three of the four trials in children [TADS, HCJE, and X065] and Gibbons’ meta-analysis had significant differences. Trial LYAQ was not significant. But all the p value tells us is that there’s a difference. It says nothing about the strength of that difference. A cup of coffee helps some headaches; three Aspirin tablets is a stronger remedy; and a narcotic shot is usually definitive. All are significant, but there’s a big difference in the strength of the effect. There are three common ways to express the strength of the effect mathematically: the Effect Size, the Number Needed to Treat; and the Odds Ratio. Here’s just a word about each of them:
-
Effect Size: It’s the difference in the mean values of the placebo group and the treatment group divided by the overall standard deviation [a measure of variability]. It makes intuitive sense. The greater the differences in the group means, the stronger the effect. The more the variability, the less the strength. Calculating it requires a lot of information and some fancy formulas, but the concept is simple. The greater the Effect Size, the stronger the treatment effect.
-
Number Needed to Treat: This is figured differently. You need to know what proportion of subjects in each group reached some predefined goal – like response or remission. So if 5% of the placebo group got over their headache in 2 hours and 55% responded in the same period to Aspirin, the NNT would equal 1 ÷ (0.55 – 0.05) = 1 ÷ 0.50 = 2. The way you would say that is "you need to treat two subjects to get one headache cure." Here, the lower the NNT, the stronger the treatment effect.
-
Odds Ratio: The Odds Ratio uses the same parameters as the NNT. Using the above values: for placebo, the odds would be 0.05 ÷ 0.95 = 0.0526 of getting relief; for Aspirin, the odds would be 0.55 ÷ 0.45 = 1.22. So the Odds Ratio is 1.22 ÷ 0.0526 = 23.2. Obviously, the greater the Odds Ratio, the stronger the treatment effect.
So armed with my formulas and a speadsheet, I set out on my quest. There was no way I could check Dr. Gibbons’ main statistical calculations. I didn’t have the raw data; I didn’t have the software; and I barely understood the statistics he used and had no clue how to do the calculations. That’s a bunch of obstacles. But I could at least try to compare the four studies he’d used to his reported outcome with more familiar and usual tests of treatment effect. But I ran into trouble immediately because some of my calculated NNT and OR values differed from his. I assumed I’d done something wrong [this is hardly stuff I do everyday – like actually my first time, to be honest]. So I engaged all the wives and the savvy, and they not only confirmed my values, but found some other discrepancies in his arithmetic, shown in this table:
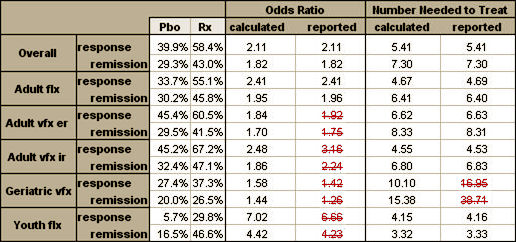
So I plowed ahead and calculated everything that I had the information available to calculate. I could find enough to compute the Effect Size for all four studies, but not Gibbons’ meta-analysis. The only study that used the same Response criteria as Gibbons was HCJE. But the three positive studies [TADS, HCJE, and X065] used the same Remission criteria he used. LYAQ reported neither Response nor Remission. So I ended up with this table [worksheet download here]:
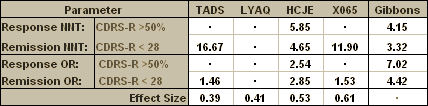
Looking at the table, I had almost complete information for comparison for the Remission NNT and the Remission OR. And the missing LYAQ values don’t matter because LYAQ was a negative study. No matter what the Response and Remission Rates were, the placebo and treatment values would be close to the same – the OR would approach one and the NNT would be very high [approach Infinity]. In case it’s not immediately apparent what that means, here it is in words. Using the OR and NNT, the strength of the treatment to obtain a Remission reported in Dr. Gibbons’ meta-analysis was greater than that of every trial he used in his analysis [a lower NNT and a greater OR]. That’s just not a possibility, no matter how he derived his numbers.
I don’t want to hide behind the numbers like I think Gibbons et al did. This result makes sense to me. It just didn’t seem realistic to take some old studies and reanalyze them and suddenly find that they said something new and different – whether you like the new conclusion or not. That’s just not how numbers actually work.
Sorry, the comment form is closed at this time.