 John Henry was an American Folk Hero. He was a steel driving man in the era when they laid the railroad lines by hand. In one version of the legend, when they introduced a steam-driven hammer to cut the tunnels, John Henry and the new-fangled machine were pitted against each other. John Henry won with his hammer, but then He laid down his hammer and he died, Lord Lord. He laid down his hammer and he died…
That’s the situation for most of us vetting the modern industry-funded Clinical Trials. The company statisticians have PhDs and use powerful [and expensive] software like SAS or SPSS running Linear and General Linear models capable of sophisticated analyses. We’re like John Henry, armed with only a computer calculator, a spreadsheet program, and scattered Internet Calculators – oh yeah, they have the data and we have only the proxies that we can gather from the published papers.
Frankly, I don’t know how many clinicians even want to know how to evaluate the reported findings in these clinical trial articles themselves. The waves and raves of psychopharmacology that started decades ago are finally on the wane, so the period when such skills would be of general use may be passing. But I think I see it as Continuing Medical Education. We’re already in an era where data of all kinds is a part of our daily medical practice – with the electronic medical records, the "Os" [HMOs, PPOs, etc], and population studies, data comes from every direction. Sailing between the Scylla of cost containment and the Charybdis of profit-based medicine will become increasingly difficult without a practiced intuition about all kinds of data and data processing. So I’m inclined to continue to pass on the few tricks of the trade that have been handed over to me in these last few years. To borrow a term from some of my colleagues in the recent Study 329 project, it’s just part of the healthy skepticism that should accompany any medical career. And the term evidence-based medicine is meaningless if you’re not fluent in the ways and means of evaluating evidence for yourself. Here are a couple of methods if you don’t already have some:
METHOD 1 – the spreadsheet:
-
The two columns labeled STDEV calculate the Standard Deviations using the MEAN and SEM [Standard Error of the Mean] for the CONTROL and DRUG respectively. Articles usually report the Standard Error [se or sem] rather than the Standard Deviation [sd or σ]. But it’s easily converted using the formula:
sem = σ ÷ √n or σ = sem × √n
-
For what comes next [POOLED STDEV], we combine these two σs [σ1 and σ2] into a pooled σ using the formula:
σ = √((σ1²×(n1-1)+σ2²×(n2-1))÷(n1+n2-2))
-
And the column labeled MEAN DIFFERENCE is just what it says – the absolute value of the difference between the CONTROL and DRUG MEANs.
-
The column labeled P-VALUE uses the two sample sizes, the POOLED STDEV, and the MEAN DIFFERENCE plus a built-in T-Distribution function to come up with the P-VALUE [just a bit of spreadsheet magic].
-
The EFFECT SIZE column is the absolute value of the MEAN DIFFERENCE divided by the POOLED STDEV ergo Cohen’s d.
-
And finally, the last two columns are the 95% Confidence Intervals for the EFFECT SIZE, derived from the EFFECT SIZE and the two sample sizes with a mouthful of a formula [from atop Mount Sinai]:
CI[95%]=d±1.96×√(((n1+n2)÷(n1×n2)) + d²÷(2 ×(n1+n2)))
So, for starters, here’s a simple spreadsheet I made a couple of years ago that’s been helpful along the way. You can download it for your own use by clicking here. You can save it to your download folder, or open it and then save it wherever you want [it’s a small file – about the size of a graphic]. If you’re not spreadsheet literate or don’t have one on your computer, go down the page to METHOD 2 – the calculators]:
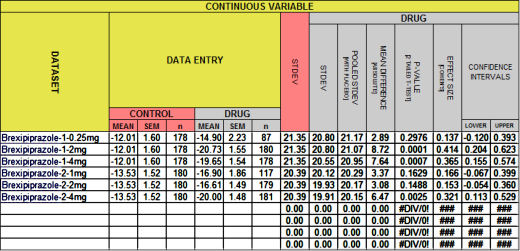
If it looks familiar, it’s what I used to fill in the empty spaces in the table in in the land of sometimes[5]… from the Brexpiprazole trials in Schizophrenia. This one:
| BREXPIPRAZOLE Trials in Schizophrenia
|
|||||||||
| STUDY | DRUG | MEAN | SEM | σ | n | p | d | lower | upper |
| Correll et al |
placebo | -12.01 | 1.60 | 21.35 | 178 | – | – | – | – |
| 0.25mg | -14.90 | 2.23 | 20.80 | 87 | 0.3 | 0.14 | -0.120 | 0.393 | |
| 2mg | -20.73 | 1.55 | 20.80 | 180 | <0.0001 | 0.41 | 0.204 | 0.623 | |
| 4mg | -19.65 | 1.54 | 20.55 | 178 | 0.0006 | 0.36 | 0.155 | 0.574 | |
| Kane et al |
placebo | -13.53 | 1.52 | 20.39 | 180 | – | – | – | – |
| 1mg | -16.90 | 1.86 | 20.12 | 117 | 0.1588 | 0.166 | -0.067 | 0.399 | |
| 2mg | -16.61 | 1.49 | 19.93 | 179 | 0.1488 | 0.153 | -0.054 | 0.360 | |
| 4mg | -20.00 | 1.48 | 19.91 | 181 | 0.0022 | 0.321 | 0.113 | 0.529 | |
As most of you already know, the cells in your spreadsheet program [I use the free Open Office Calc] can hold one of three things: a number, some text, or a formula that shows the results of operations on the data in other cells. So the seven columns on the left are just empty cells for Data Labels and Data Entry. The eight cells on the right hold formulas that compute the results.
METHOD 2 – the calculators:
-
Converting the Standard Error of the Mean to the Standard Deviation is just too easy for anyone to make a calculator that I could find. So you’re on your own. The formulas:
sem = σ ÷ √n or σ = sem × √n
-
For finding the p-value from the Mean, number of subjects, and either the Standard Deviation or the Standard Error of the Mean, I use GraphPad QuickCalcs. It’s self explanatory.
-
For calculating Cohen’s d and its 95% Confidence Limits, I am using Psychometrica [Comparison of groups with different sample size (Cohen’s d, Hedges’ g)]. It’s self explanatory too.
-
So I used them to fill in the table. Note: In the table above, only the values in red are from the spreadsheet. The rest are from the articles. In the table below, all the ones in blue were calculated using the Internet Calculators:
| BREXPIPRAZOLE Trials in Schizophrenia
|
|||||||||
| STUDY | DRUG | MEAN | SEM | σ | n | p | d | lower | upper |
| Correll et al |
placebo | -12.01 | 1.60 | 21.35 | 178 | – | – | – | – |
| 0.25mg | -14.90 | 2.23 | 20.80 | 87 | 0.2976 | -0.137 | -0.393 | 0.120 | |
| 2mg | -20.73 | 1.55 | 20.80 | 180 | 0.0001 | -0.414 | -0.623 | -0.204 | |
| 4mg | -19.65 | 1.54 | 20.55 | 178 | 0.0007 | -0.365 | -0.574 | -0.155 | |
| Kane et al |
placebo | -13.53 | 1.52 | 20.39 | 180 | – | – | – | – |
| 1mg | -16.90 | 1.86 | 20.12 | 117 | 0.1629 | -0.166 | -0.399 | 0.067 | |
| 2mg | -16.61 | 1.49 | 19.93 | 179 | 0.1488 | -0.153 | -0.360 | 0.054 | |
| 4mg | -20.00 | 1.48 | 19.91 | 181 | 0.0025 | -0.321 | -0.529 | -0.113 | |
So finally for just a few miscellaneous matters – one of which is actually important and the reason this post is here. The important one first:
-
[revised for clarity] In all the posts I’ve made about Brexpiprazole, no-one has noticed that the versions I’ve been showing in these tables have something missing. And it’s an error that is repeated in article after article. I’m showing pairwise statistics on two studies, each of which has four groups. There’s no mention of the omnibus statistic – the one way analysis of variance that should come first to justify using these pairwise statistics. No statistics professor would [or should] let that pass unnoticed. It’s so common in RCTs that it’s rarely even commented on. I didn’t see it until after my first post was already up, and that was only because the Paxil Study 329 had alerted me to the issue. I let it ride thinking someone might notice, but no one did. If you don’t know what I’m talking about, the next post will explain it, and it’s something worth understanding in my opinion. The easiest way to say it is that I have to prove that I have the justification to do the pairwise analyses.
-
Method I is a whole lot faster. It’s saved to my desktop and when I read an RCT, I’m filling it out on my first pass through the article because it’s so helpful in evaluating what I’m reading. Speed is the reason I made it. Looking up the Internet Calculators, entering the numbers, and then writing the results on the back of an envelope as I go is basically just a lot of trouble.
-
If you use it and want to hold onto the results, save it under another name so as not to damage the underlying formulas. I didn’t protect any cells because I get annoyed when others do that. I invariably want to make some changes, and unprotecting is something of a pain. If it gets messed up, just come back here and reload it.
-
Don’t worry that I’m going to go on and on about all this number/statistics stuff. If you’re not interested, just skip any post that has john henry in the title. I’ll get back to the day to day kvetching about the sorry state of science in psychiatry in a week or so. But I’ve gotten enough email chatter to realize that there are some soul-mates who want to explore these jake-leg ways of vetting the RCTs.
-
Finally, if I get something wrong, don’t hesitate to let me know. I’m learning too. This stuff wasn’t covered in psychoanalytic training either…
Industry may have the PhD statisticians and the expensive software, but these days you can get free, open source statistical analysis packages that are just as powerful as SAS and SPSS – if not more so. This blog has achieved very astute and penetrating analysis of statistical shenanigans using basic statistical formulas and simple tools, but for exploratory data analysis and larger datasets, consider using R (or getting an intern who has already climbed the R learning curve). I recommend R Studio (a free IDE) and one of the many free courses in R on the web.
Analyst,
I couldn’t agree more. I learned R for our analysis of Paxil Study 329 and was awed at its power and ease of use, though some of the documentation is at times esoteric. But really no complaints. The problem with R [tongue in cheek] is that it requires data. And without that, it’s like having a Jaguar XKE in a world with no gasoline.
This little series is attempting to catalog “vetting” tools one can use in a world where the other side has all the fuel. If “summary” data is supplied in the article [MEAN, SD or SEM, and n], one can do a lot of checking. And some of the “Internet calculators” are a big help. But many papers don’t even provide adequate “summary” data. In some cases, one can extract it by something resembling “back calculation.” For example starting with p and n and working your way backwards. That’s coming soon.
But back to your main point. If you have the actual data in hand, R is, indeed, a thing of great beauty! I hope for a day when we have the Data Transparency we need so we can have the luxury of using it!…
“…or getting an intern who has already climbed the R learning curve…”
A private practice psychiatrist could 1099 a stats savvy medical or pharmacy student to take on what both of you are describing. On a question of interest to that psychiatrist. They could probably pay a fair wage and still buy 10-15 hours of student time for every hour they bill. That might make this vetting process much more doable for many of us. And, make us perhaps much less dependent on the clinical trialist KOLs who have not done so well by U.S. In some instance.
If Sense about Science, Goldacre, whoever, built a front end using the template of a freelancing marketplace site it might become a fairly straightforward process to find someone. And they’d get paid for their labor. What a novel concept.
That kind of a site could also integrate in free shared blackboard software that would allow the trainee to walk the doc/NP/whoever through the back of envelope analysis you are talking about. Trainees who have done clinical acumen to inform their lens would be ideal. The purchaser would likely learn something in the process (I.e. Start learning to fish not just buy fish, to stretch the metaphor).
If both parties agree then the shared blackboard walk through would be recorded, uploaded to YouTube, and searchable by keywords assigned at time of creation.
The site could include brief tutorials for the trainees and links to mentorship around performing this work in an imperfect, but efficient and clinically relevant way. Essentially what you are trying to do with these blog posts.
In practice it might look like this: I’m a psychiatrist in full time clinical practice with limited understanding of stats. Three new neuroleptics have come out recently and I’m trying to get a sense of which, if any, I might want to start using as second or third line agents. Which would be highest yield for building up my experience with it in my clinical population. I post the question, perhaps including reference to the papers of highest interest to me, and trainees come back saying here are the number of hours it would take and how soon they could get it done. Eventually trainees would haVe reviews of their work you could read AMs/or videos of their walkthrougks you could watch. You enlist someone and they basicLly provide you a combination of information akin to Gdacre’s new site (how do the papers compare to the registries) and the calculations you present here. People would be able to annotate the archived walkthrougks with comments. If a month later another doc has a similar question they would find the one you commissioned on search. Then they could generate a more refined question. Or just buy an hour of time from a trainer they have a relationship with to walk them through it again (hopefully the site could store an appendix with the raw back of envelope data used to do the first analysis).
The site could take a small percentage of the fee to again actually PAY whoever maintain the site. If you got someone who knew what they were doing, and could create a good user interface, this could work.
It would also require a HUGE culture shift. In people actually seeing this as a professional expense they should shoulder. But if one comes to believe that we can no longer 100% trust journal editors and peer review (and anyone who does should retread the letter to AACAP membership from the JAACAP editor in chief about Study 329) then trading one hour of billable time for 10-15 hours of focused trusted analysis does not look so strange anymore.
This is awesome, thanks for all your hard work and all these statistics posts are epic.