The Categorical Variables just get one post. It’s not because they aren’t important. It’s because I’ve already said what I’m up to in this series. And because they’re easy…
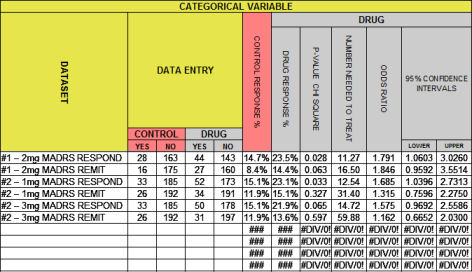
I thought it would be easiest to start with the spreadsheet itself this time because the column headings make it easy to discuss the output. This spreadsheet has been added below the one discussed in john henry’s hammer: continuous variables I…, downloadable here. It’s shown above with the MADRS efficacy data from the two recent Brexpiprazole Augmentation-in-Treatment-Resistant-Depression studies [see a story: the beginning of the end…].
Categorical Variables show up in almost every Clinical Drug Trial. They are derived variables that hold binary [yes/no] data based on some specified criteria. They’re often named, though the criteria for the names vary from study to study. So RESPONSE might be «final HAM-D score < 50% of the baseline» or «final HAM-D score < 50% of the baseline OR final HAM-D score < 8». In this case, the data is usually reported in the articles – the tally of the yeses and nos. Unlike the Continuous Variables, defining the dataset with Summary Data requires no mathematical manipulations [MEAN, Standard Deviation, Standard Error of the Mean], all you have to do is count.
The classic statistical test for significance is ChiSquare, discussed in in the land of sometimes[2]…. The spreadsheet supplies two measurements of EFFECT SIZE. The first, Number Needed to Treat [NNT], is the more intuitive. It’s exactly what its name says, how many patients you have to treat to get one that beats what you would’ve gotten with placebo. The second EFFECT SIZE index is the ODDS RATIO [OR]. It is a quantitative measure frequently reported in meta-analyses where multiple studies are compared. One thing to note, unlike Cohen’s d, the Odds Ratio is not centered between the the 95% Confidence Intervals, so it is often charted on a logarithmic scale [which "centers" the OR]. For the mathematically inclined, the formulas for these column are:
Sorry, the comment form is closed at this time.