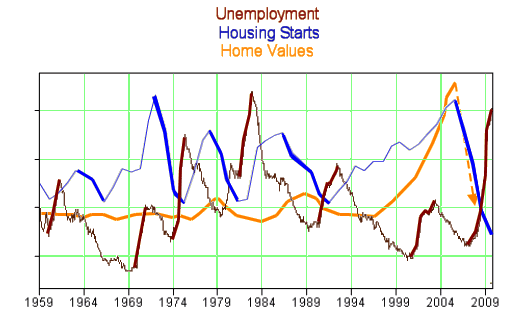
The last graph in the last post was pretty striking to me – the sustained rise in housing starts that lasted for 13 years just doesn’t seem to have a precedent. I replotted it with party-in-power and didn’t see much that looked like a relationship. Something else was afoot. Then I plotted unemployment [Recessions] and housing starts on the same timescale – curious to see if there was a relationship between building and Recession [it seemed like there ought to be].

As expected, there is something of an inverse relationship – at least there used to be. Either a fall in building is followed by rising unemployment or a fall in unemployment leads to a rise in building [I’ll leave the chicken/egg part to the real economists]. They do something of a dance with each other [Okay, it’s not perfect, but it’s close enough for government work]. But look what happens in the early 1990’s. Unemployment falls and building goes up as expected. But with the Recession [rising unemployment of 2001], the building barely blips, then just keeps on going. It rose until 2006 when the "housing bubble" burst. Then it plunged precipitously, ushering in a really big Recession – our biggest since the Great Depression. It looks as if we skipped a step.

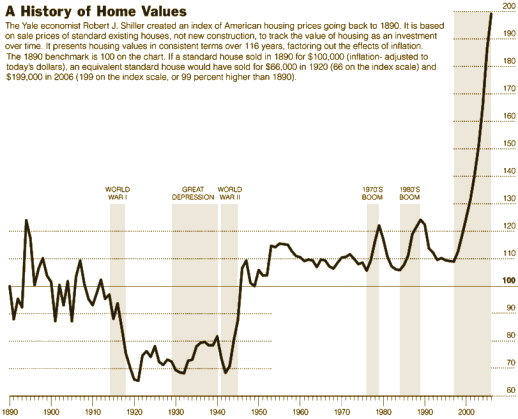
When I first saw this graph of home values [Case-Shiller] corrected for inflation, I was awed. Home value is pretty much level. While that makes perfect sense, it’s just not how we think about things [though we should’ve]. So do I dare add yet another parameter to my already burdened graph. Why not?

[Madness, this?] Well, for starters, it looks like the boom in housing values in the 1970’s and 1980’s came at a time when building slowed down. That kind of makes sense. But look at the "housing bubble" [1997-2006]. Home values soared at a time when building was on the ascendency. Home values and housing starts soared together! Shouldn’t happen.
My speculation is that the burst of sub-prime lending and CDO trading interrupted the usual cyclical rise and fall of building and set us up for going off of a big cliff…
Depository Institutions Deregulation and Monetary Control Act of 1980: This legislation expanded the Federal Reserve’s rules to all Banks, and raised the level of FDIC coverage from $40,000 to $100,000. But it also began the Derugulation of Banking Institutions and the erosion of the Glass-Stegall Act:
- Banks were allowed to merge.
- It removed the power of the Federal Reserve to set the interest rates of savings accounts.
- It allowed credit unions and savings and loans to offer checkable accounts.
- Allowed institutions to charge any interest rates they choose.
Garn-St. Germain Depository Institutions Act of 1982: This Bill was passed to deregulate the Savings and Loans Industry. From the FDIC history:
"This Reagan Administration initiative is designed to complete the process of giving expanded powers to federally chartered S&Ls and enables them to diversify their activities with the view of increasing profits. Major provisions include: elimination of deposit interest rate ceilings; elimination of the previous statutory limit on loan to value ratio; and expansion of the asset powers of federal S&Ls by permitting up to 40% of assets in commercial mortgages, up to 30% of assets in consumer loans, up to 10% of assets in commercial loans, and up to 10% of assets in commercial leases."What followed wasn’t exactly what Reagan predicted. There was a rapid proliferation of Savings and Loans that had very imprudent lending practices, living outside the regulatory reach of conventional Banks. Within five years, there was a Savings and Loans Crisis:
The savings and loan crisis of the 1980s and 1990s (commonly referred to as the S&L crisis) was the failure of 747 savings and loan associations (S&Ls) in the United States. The ultimate cost of the crisis is estimated to have totaled around $160.1 billion, about $124.6 billion of which was directly paid for by the U.S. government—that is, the U.S. taxpayer, either directly or through charges on their savings and loan accounts—which contributed to the large budget deficits of the early 1990s. The concomitant slowdown in the finance industry and the real estate market may have been a contributing cause of the 1990–1991 economic recession. Between 1986 and 1991, the number of new homes constructed per year dropped from 1.8 million to 1 million, the lowest rate since World War II…Gramm-Leach-Bliley Act of 1999:
The Gramm-Leach-Bliley Act … is an Act of the United States Congress which repealed part of the Glass-Steagall Act of 1933, opening up competition among banks, securities companies and insurance companies. The Glass-Steagall Act prohibited a bank from offering investment, commercial banking, and insurance services. The Gramm-Leach-Bliley Act (GLBA) allowed commercial and investment banks to consolidate. For example, Citibank merged with Travelers Group, an insurance company, and in 1998 formed the conglomerate Citigroup, a corporation combining banking and insurance underwriting services under brands including Smith-Barney, Shearson, Primerica and Travelers Insurance Corporation. This combination, announced in 1993 and finalized in 1994, would have violated the Glass-Steagall Act and the Bank Holding Company Act by combining insurance and securities companies, if not for a temporary waiver process. The law was passed to legalize these mergers on a permanent basis. Historically, the combined industry has been known as the financial services industry.Commodity Futures Modernization Act of 2000: This Bill by Texas Senator Phil Gramm was the Hurricane Katrina of deregulation:
The Commodity Futures Modernization Act of 2000 … is United States federal legislation which repealed the Shad-Johnson jurisdictional accord, which had banned single-stock futures in 1982. The legislation also provided certainty that products offered by banking institutions would not be regulated as futures contracts… The Commodity Futures Modernization Act of 2000 has received criticism for the so-called "Enron loophole," which exempts most over-the-counter energy trades and trading on electronic energy commodity markets. The "loophole" was drafted by lobbyists for Enron working with senator Phil Gramm seeking a deregulated atmosphere for their new experiment, "Enron On-line."
The bigger they are, the harder they fall.
It must take about a generation to forget lessons learned. By the 1980’s the people who were adults during the 1929 Crash and the Great Depression that followed were old or gone. Their frugality and worries about financial safety were becoming something of a joke – "depression era" thinking we called it. The Banks were straining at the bit against the tight restrictions left over from the New Deal. The rich were oppressed by the heavily graduated income tax that paid back for the New Deal and World War II. Our system needed to be modernized, they said. And their hero was the unlikely B-Grade Actor, Ronald Reagan. And he did what they wanted.
 The net result was an explosion of something now called "Financial Services" with mega-banks and armies of technology laden financiers combing the ecpnpmy for ways to make a profit not from what businesses produce, but from the conduct of business itself. They needed for there to be continuous growth to support the financial industry, and with deregulation, they had the tools to make it happen. They could actually game the whole system itself.
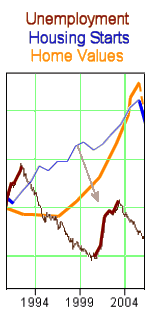
I expect my spaghetti graph showing the inverse relationship between unemployment [Recession] and building is just one of many such relationships operating in our economy – feedback systems that keep us level in the road – part of the supply/demand equation of classical macroeconomics. With the tools provided by deregulation [huge banks, the derivatives market, unrestricted interest rates, the creation of cdo’s, credit default swaps, "exotic financial instruments", etc. etc.] they were able to over-ride the cybernetics [feedback loops] of Capitalism and the Free Market. By markedly lowering the requirements for borrowing money, they created a demand at a time when demand should have fallen [brown arrow]. House Values rose artificially in the environment of "easy money," and a feeding frenzy of house buying and house building continued even though house prices rose beyond any rational imagining. Even people with absolutely no financial intuition [like yours truly] sold their houses because they could hear the clock ticking. If I heard it, that means it was deafening. So we skipped a building correction [brown arrow] and the collateral damage is obvious to all of us – every day.
What my spaghetti graph says is that deregulation, something that was touted to be in the service of "Free Market Capitalism" actually destroyed the "Free Market." It wasn’t "Free" anymore, it was the product of manipulation by the Financial Industry. And that Financial Industry is still there, pouring money into political campaigns to keep it going, to maintain deregulation in the face of its dismal outcome – preaching Capitalism and the Gospel of the Free Market while actually destroying both in the process. In the words of of the folk song:
In addition to being highly instructive, a fair number of your graphs along the way could stand a special exhibition at MOMA.
[…] skipped a step… […]
[…] skipped a step… […]