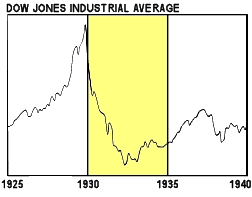
 Obviously, the most watched index is the DOW JONES INDUSTRIAL AVERAGE – "the market." After a bust of growth in the late 1920s, the DOW fell precipitously, and it kept falling until 1933. In the graph on the right, the x-axis is at zero [meaning that stocks were essentially worthless]. With F.D.R.s New Deal, the market began to recover, but then took another fall in 1937. That 1937 fall in an important lesson that economists talk a lot about these days. F.D.R. apparently felt really pressured by the criticism of his New Deal spending and backed off in his second term. That was a mistake that lead to a Recession that lasted until World War II broke out. F.D.R.’s critics say that the War is what ended the Depression, not the New Deal. But most economists say that the war compensated for his mistake. Their take ion the lesson of 1937 is don’t let off on the support too soon, the recivery always looks better than it really is.
 The Market "crash" last year was certainly devestating to our retirement plans, and the initial plunge was as steep as the 1929 Crash, but it was not so sustained. And it only fell to 50% [ish] of its high water mark. Now it seems to be rebounding – finding a new level at about 70% of its previous high. Given the alternatives, I, for one, am pleased with this new level. The DOW had been sliding for much of 2008. Bush had handed out rebate checks to shore things up [mine was $1.57]. But most of us had no idea how much trouble we were in until Lehman Brothers went belly-up, and the bottom fell out of things. Since then, we’ve pumped a Trillion plus into keeping the Banks from going under and nationalized a number of them. It was the failure of Banks that took our economy out in the early 1930s, and no one wanted to let that happen to us again.
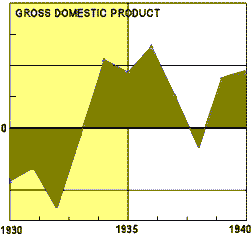
 So does the rebounding Stock Market mean we’ve dodged the bullet? The answer is "No," though it’s a good sign. There are other economic indicators that we hear about on the news that usually go un-noticed, but have come to matter a lot more recently. The GROSS DOMESTIC PRODUCT [shown here as percent change since the last report] measures the our productivity. During The Great Depression, it stayed below zero for three years [meaning that productivity continued to fall throughout those three years]. Notice again what happened in 1937. When F.D.R. let up on his economic support, productivity fell off drastically. Note that these values are only available as yearly percentages as opposed to the modern data available per quarter.
 There was a fall in the GROSS DOMESTIC PRODUCT that antedated the 2008 Stock Market Crash [though I was oblivious to it like I think most people were]. But in the third quarter, productivity plummeted along with everything else. We were all glad to see last week’s release of the second quarter 2009 GDP. While it’s still negative, it’s on the mend. Who knows where its headed, but again, considering the alternative, it’s the best of news [cross fingers, throw salt over the left shoulder]. On the news, they use phrases like "people are restocking their inventories." In the Capitalistic world we live in, production is the bedrock of our economy. What drives production? Simple. It’s driven by consumption. So, ultimately, production is just the supply side of the supply and demand nature of a free market economy like ours.
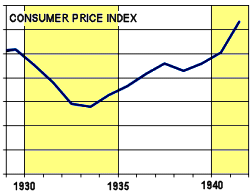
 There’s another economic indicator I’ve heard mentioned on the news all my life, but never paid attention to [if fact, I didn’t even know what it meant]. It’s the CONSUMER PRICE INDEX. The CPI is the cost of a standard package of goods, and is a measure of inflation. It must be difficult to derive, finding a set of products that can be price compared over time. Contrary to the way we usually talk, INFLATION [within reason] is apparently a good thing [though I still long for the 5¢ coke]. DEFLATION is the bad thing. It means that prices are dropping because people are panicking, getting rid of their goods. That can lead to a DEFLATIONARY SPIRAL when goods lose their value, production falls, jobs are lost, etc. In the 1929 Crash, there was such a Deflationary Spiral. Also, at the risk of being monotonous, notice the 1937 dip.
 In the recent Recession/Depression, there was a Deflationary Trend in the third and fourth quarters of 2008. That’s the biggest of deals and tells us that this was no small Recession, but was rather an emergency in our economy. When they talk about this being the worst recession since the war [World War II], this is one of the reasons. A sustained Deflationary Spiral in a Free Market economy portends a very slow recovery. In practical terms, it means that there’s no incentive to produce goods – falling production, rising unemployment, a failing economy unable to get any traction to right itself. Three years in a Deflationary Spiral was devastating to the economy of the 1930s [and is the reason our parents were such a bunch of tightwads – the "Depression Mentality"].
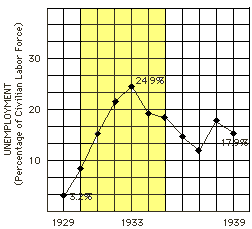
 But the bottom line economic indicator is UNEMPLOYMENT. Tightening one’s belt through a Recession is one thing. Having no income at all is quite another. In the Great Depression, as the Stock Market tumbled and the Banks began to fail, Unemployment rose steadily. In a Recession, Unemployment may rise over 10%, but then begins to fall. In the 1930s, it just kept going. The Deflationary Spiral lead to decreased production and Unemployment reached new heights. F.D.R. put people to work in C.C.C. Camps, on W.P.A. Projects, anything he could think of the break the cycle of rampant Unemployment [which soared to about one in four workers]. In my opinion, that was what turned things around. And after four years, he let up [in 1937] and Unemployment shot upwards immediately. It was finally reversed when we went into overdrive to produce the war machinery that went into the effort to win World War II.
 With this economic dip, Unemployment had already been rising since early 2008, but it continued with a vengeance as the economy slowed. The rate of rise was as fast [or faster] than during the 1929 Crash. In a recovery, Unemployment lags behind the other economic indicators. Businesses tend to "get on their feet" before they begin to rehire workers. In the current situation, we don’t yet know what’s going to happen. The Unemployment figures for last month were continuing to rise, but only at 0.1%/month [instead of 0.4 or 0.5%/month as they’d been doing for almost a year.] On the graph, there’s a little downturn at the end that’s very encouraging, but only if it’s sustained. The new monthly figures come out next week, and are sure to be plastered on every blog and newscast. Leveling off or falling Unemployment means we’re coming out of the woods.
Obama has had an enormous task. This Crash wasn’t simple. It involved a failure of regulation, the rise of mega-banks, the financial derivative market, the internet/housing/ oil bubbles – lot’s of stuff. In addition, the Economists were clamoring for a much larger Stimulus Bill. The Republicans and Right Wing Media were opposing any Stimulus and wanted to cut taxes [again]. And there was something else – a huge something else.

The Ronald Reagan and the Bush Presidencies had cut taxes [a vote getter] and escalated the National Debt to new heights. Obama doesn’t have the buffer and the borrowing power that F.D.R. had in the 1930’s. George W. Bush had just thrown a Trillion Dollars at the rogue Banks that had a misadventure with the Derivative Markets, on top of two expensive wars, and some hefty and irresponsible tax cuts. As I look at the economic indicators, it looks like Obama and his advisors might bring off a recovery, but at great cost [on top of the fruits of his less than sensible predecessors]. And if he does bring it off, his critics are going to say it would’ve taken care of itself without his interventions [which is a crazy, crazy, thought].
- > 10.0% = uh oh!
- 9.5% – 9.9% = wait until next month
- < 9.4% = out of the woods!

| Next Release: August 7, 2009 |
| The Employment Situation for July 2009 is scheduled to be released on August 7, 2009, at 8:30 A.M. Eastern Time. |

[…] budget in order to get the debt down. On the other hand, in order to avoid the 1937 mistake [see below], he’s going to have to continue to support the economy. He’s going to have to pass […]
[…] on Friday 7 August 2009 We couldn’t expect any better news than this. Earlier in the week, I set these criteria [fitting the figure on the […]