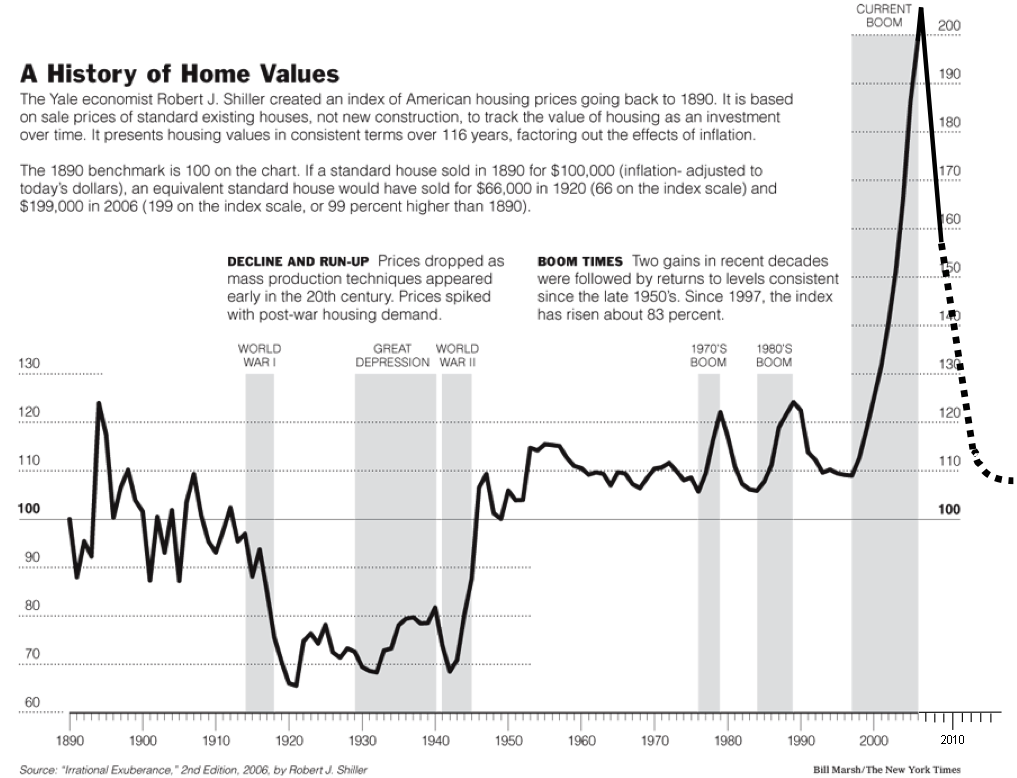
The Case Shiller Index for August was published today People were disappointed, and the DOW dipped. That makes no sense at all to me. The often published graph above [case-shiller 20 city] suggests that the housing bubble being over, home values should return to where they were before it started. Below is the last 33 year 10 city case-shiller with 2010 inset.

So what’s the game? Let’s pretend that the case-shiller stopped halfway down? Why would it? No wonder houses aren’t selling. They’re still over-priced?
UPDATE: I found this from April. It varies a lot from place to place:
Here in Atlanta, things are back to normal [current]:
Very confusing stuff, this housing bubble data/behavior…


Sorry, the comment form is closed at this time.