RTM is a statistical phenomenon that occurs when repeated measurements are made on the same subject or unit of observation. It happens because values are observed with random error. By random error we mean a non-systematic variation in the observed values around a true mean (e.g. random measurement error, or random fluctuations in a subject). Systematic error, where the observed values are consistently biased, is not the cause of RTM. It is rare to observe data without random error, which makes RTM a common phenomenon.The figure illustrates a simple example of RTM using an artificial but realistic1 distribution of high density cholesterol (HDL) cholesterol in a single subject. The first panel shows a Normal distribution of observations for the same subject. The true mean for this subject (shown here as 50 mg/dl) is unknown in practice and we assume it remains constant over time. We assume that the variation is only due to random error (e.g. fluctuations in the HDL cholesterol measurements, or the subject’s diet).
Graphical example of true mean and variation, and of regression to the mean using a Normal distribution. The distribution represents high density lipoprotein (HDL) cholesterol in a single subject with a true mean of 50 mg/dl and standard deviation of 9 mg/dl.In the second panel we show an observed HDL cholesterol value (from this Normal distribution) of 30 mg/dl, a relatively low reading for this subject. If we were to observe another value in the same subject it would more likely be >30 mg/dl than <30 mg/dl (third panel). That is, the next observed value would probably be closer to the mean of 50 mg/dl (third panel). In general, when observing repeated measurements in the same subject, relatively high (or relatively low) observations are likely to be followed by less extreme ones nearer the subject’s true mean.
 If you sample something and happen to be far from the Mean in either direction, your next sample is very likely to be closer to the Mean. It’s just the way random errors work.
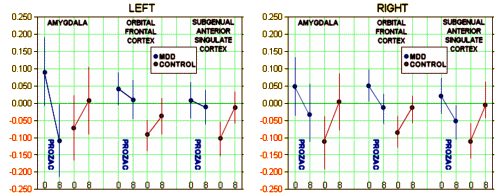
I think the article in question [Brain Activity in Adolescent Major Depressive Disorder Before and After Fluoxetine Treatment] might well be a really great example. The baseline values for the MDD/Prozac Group and the Healthy Control Group [arrows] were picked in the first place because they were maximally different – a "hot spot." So you sample that same place again, and it stands to reason that the next sample will be closer to the Mean. The initial values were picked because they were "outliers" – what Dr. Turkheimer calls maxima. Next time around they’re Regressing Toward the Mean. And that explains the oddness of the Control Group moving to meet the MDD Group in every single case.


The methodology of neuroimaging is so dense these clowns will be able to say their studies mean whatever they say they mean, and nobody will be able to gainsay them. The ideal vehicle for smoke and mirrors.
Ain’t it the truth? Just load up with software and crank it out…
I wonder if they have programs where you put in conclusions and the program adapts the data anylysis to fit?