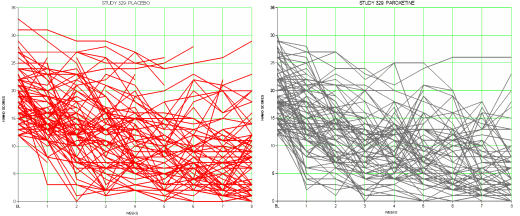
Here are the raw results from GSK’s Paxil Study 329 – the HAM-D scores from each subject for Placebo [left] and Paroxetine [right]:

I’ve transferred the data from the GSK site to a spreadsheet [downloadable]. In the table below, the only manipulation is that the mean values are in the ‘least squares mean’ format used by the Study 329 article. The average values for each Clinical Center were compiled, then averaged – correcting for unbalanced distribution of subjects among them. Otherwise, no data correction or extrapolated values were added. It’s just the observed values:

This is the graph of the least square means of the raw scores. The vertical bars are the 95% confidence limits for the mean [LSM + 1.96(SEM) where SEM = the Standard Error of the Mean = Standard Deviation ÷ Square Root(n)]. These are standard formulas from Statistics 101.


Sorry, the comment form is closed at this time.