Almost everyone knows what a p value is – how probable is it that a difference is real and not just a sampling error? And we know p < 0.05 is good enough; p < 0.01 is real good; and p < 0.001 is great… But all the p value tells us is that there’s a difference. It says nothing about the strength of that difference. A cup of coffee helps some headaches; three Aspirin tablets is a stronger remedy; and a narcotic shot is usually definitive. All are significant, but there’s a big difference in the strength of the effect. There are three common ways to express the strength of the effect mathematically: the Effect Size, the Number Needed to Treat; and the Odds Ratio. Here’s just a word about each of them:
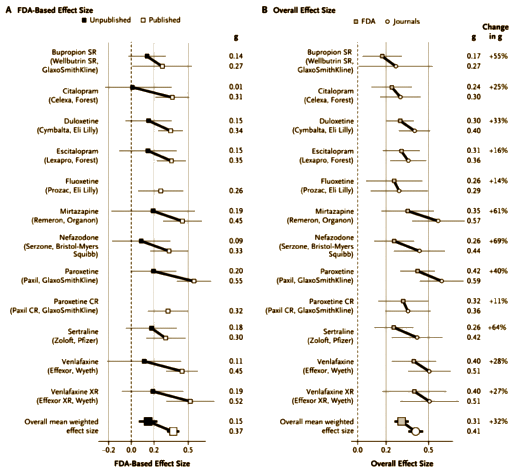
The effect-size values derived from the journal reports were often greater than those derived from the FDA reviews. The difference between these two sets of values was significant whether the studies (P=0.003) or the drugs (P=0.012) were used as the units of analysis [see Table D in the Supplementary Appendix].

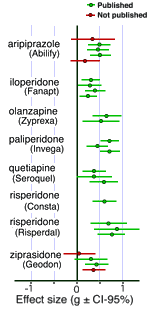
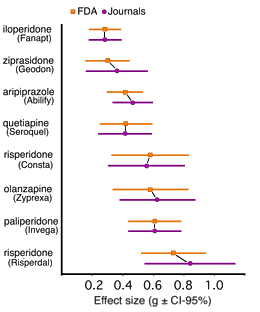
I mentioned that this same group did a similar study in 2012 on the Atypical Antipsychotics [at least that much…]. There weren’t so many studies obviously gone missing and the sins of commission weren’t so blatant. I’d love to say that since these are later studies, maybe things are improving integrity-wise. But I expect that it simply means that the Atypicals are more potent drugs than the Antidepressants. Their problem is in the area of toxicity rather than ineffectiveness. The dodginess jumped from efficacy to safety/side effects.


Brilliant charting, thanks, Dr. Mickey!