by Nemeroff CB, Widerlöv E, Bissette G, Walléus H, Karlsson I, Eklund K, Kilts CD, Loosen PT, Vale W.Science. 1984 Dec 14;226(4680):1342-4.The possibility that hypersecretion of corticotropin-releasing factor (CRF) contributes to the hyperactivity of the hypothalamo-pituitary-adrenal axis observed in patients with major depression was investigated by measuring the concentration of this peptide in cerebrospinal fluid of normal healthy volunteers and in drug-free patients with DSM-III diagnoses of major depression, schizophrenia, or dementia. When compared to the controls and the other diagnostic groups, the patients with major depression showed significantly increased cerebrospinal fluid concentrations of CRF-like immunoreactivity; in 11 of the 23 depressed patients this immunoreactivity was greater than the highest value in the normal controls. These findings are concordant with the hypothesis that CRF hypersecretion is, at least in part, responsible for the hyperactivity of the hypothalamo-pituitary-adrenal axis characteristic of major depression.
"The results (see Fig. 1) were statistically analyzed by both parametric [analysis of variance (ANOVA) and Student-Newman-Keuls test] and nonparametric (Mann-Whitney U test) methods."
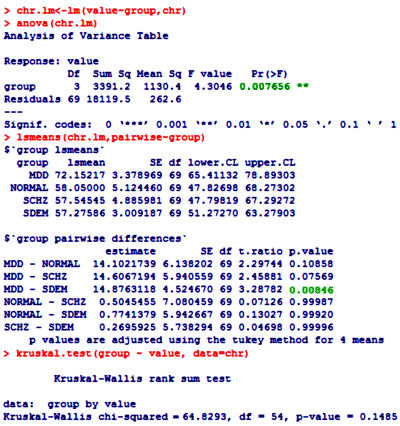
 One of the most frustrating things about papers like this is that the raw data isn’t available, even if one has the time to go over it in detail. Once again, I find myself looking at a graph that I’m told is meaningful, significant, has something to say important about a major psychiatric syndrome. And what I see looks like a trivial difference that is probably meaningless, and I even doubt significant. So I did something that I’ve been tempted to do many times. I opened it in a graphics program and reconstituted the data by measuring the pixel count to the center of each data point and using that table, the baseline, and the ordinate scale to reproduce the data. I wouldn’t recommend this on a Nobel Prize application or even in a paper, but I thought I’d give it a shot because I don’t believe the analysis is correct, or correctly done [the next paragraphs is only for the hardy].
The CSF concentration of CRF-LI was significantly increased (by both methods of statistical analysis) in patients with major depression compared to either the normal controls or the patients with schizophrenia or senile dementia."
As you may recall, when we looked at Dr. Nemeroff’s NYU Grand Rounds and London lecture to the Institute of Psychiatry, we were alerted to a study reported as positive that Dr. Nemeroff, himself, had reported as based on an error so the significance disappeared, yet he presented it as a valid study in those presentations [see has to stop…]. So the best predictor of future behavior is past behavior. Now we have GSK, the VAH, and the NIMH chasing some new drug as a treatment for PTSD based on the very shakiest of speculations. Shame on him. Shame on them. And shame on journals that don’t vet questionable studies like this.
Maybe we ought to say shame on me too for using a pixel count to get my numbers. But instead of that – why not support Data Transparency so I don’t have to resort to extreme measures to confirm my reaction to that graph. Like I said, this kind of silliness has to stop…
Whoops: [for the even more hardy] I left out this plot from the R package. The upper and lower borders of the "boxes" represent 25% and 75% of the points. The fact that the Means [bold horizontal lines] aren’t centered in the box points to a skewing of the data [not normally distributed], suggesting that the ANOVA is not the best choice of statistics, and that the non-parametric test is a more appropriate choice [Kruskal-Wallis]. My method of data capture is also more likely to be accurate using only the rank order.
In my current adventure of reading about the problems with genetic variation studies, I ran across a statement that some statisticians want to be consulted before a study is designed so that they can help to ensure that the study is well designed, rather than being called in to fudge the numbers in order to show significance afterward.
I bet pharmaceutical companies hire statisticians to make results look significant. As you say, without the raw numbers, there is no way to evaluate the study. And, I would say, that without raw numbers, they have presented no evidence, just a marketing device in the form of a graph.
Even if it could be reliably demonstrated to be true that X chemical is present in people with Y condition, so what? Does that really mean anything? Is that sufficient evidence with which to support a conclusion or a specific course of action? Using it at a diagnostic tool is wholly unsupportable without replication, peer review, and efforts to disprove it, imo, but maybe someone here can show me otherwise.
Wiley,
It looks to me as if this study was originally focused on Alzheimers. The principles were at an aging center and they had primarily AZ patients [n=29]. Even if their stats were right, this study should be repeated with sufficient normals and MDD patients to confirm these findings. At least that’s what would make sense to me.
O.K., I see your point. What I’m wondering is how is it legitimate to conclude that there is a causal relationship there? It seems to me that the body can’t be sorted into isolated systems and X means Y relationships when it comes to the brain/mind/mood. It’s like there is a drive to oversimplify for the sake of industry and profit. And when these conclusions from studies are imposed on individuals, then we’re way too far into the weeds.
Great work, Dr. Mickey! I am continually amazed by your work. And I hope Dr. Carroll adds to this discussion as he has an eagle eye for this kind of data “mis-analysis.”
Nice analysis.
The DST fad of the eighties was a harbinger of bio uber alles hype that continues to this day.
However, I was only partially correct in calling this a blind alley in an earlier post.
It was a blind alley to us, but for them an eight lane highway to more grant money.
If I were 30 year old psych residency grad today, I’d go for a PhD in quantitative psychology. There is so much nonsense out there that shouldn’t be published.
Mickey,
Thanks for explaining the math. I can follow along, but this is light years ahead of anything I had in any class.
Steve Lucas
Mickey’s blog should be a CME site for physicians, especially in the field of biostatistics which is being neglected at everyone’s peril. I’m relearning ideas I forgot by 30 and learning some new concepts as well. That was an incredible analysis of a thirty year old study that somehow passed muster. I blame the editors. Just looking at the charts without doing the math should raise eyebrows.
http://en.wikipedia.org/wiki/Robust_statistics
We’ve basically thrown tens of millions into a money pit because one subject had an outlier of 138….
Why the statistics here are a bit over my head, the observation of the elevated CRH levels major depressive patients jumps out to me and the personal searching for answers I have been doing. I suffer from both depression and anxiety with minor relief from typical antidepressants. However I’ve started on Tianeptine, which seems to help restore or regulate the stress response, something that may seem relevant to the elevated CSF levels above. For you smarter folk out there, any relevance here?
Thanks,
Mike
http://www.calmthenerves.com
I just have to ask, how did you develop such a deep understanding of statistical methodology? What was your exposure as an analyst to quantitative psych?
James,
I was a research guy in Immunology, a NIH fellowship included. I changed gears after training when I was forced to practice by being drafted. I realized that working with real people was what I was supposed to be doing. It didn’t take me long with that thought to decide that it was the people’s lives that I found so compelling, so I retrained in psychiatry and didn’t look back. I will admit to having had a lot of help from colleagues to revive my rusty stats and consider myself still a rookie…
It’s a challenge for me as well. Just so I get this right, and this intuitively makes sense to me, parametric methods are fine if the data points assume a Gaussian distribution within the groups, but if the sample size is small and there is a skewed distribution, then nonparametric methods are necessary such as K-W. Because the extreme outliers screw up averages in the first instance. Kind of like the simpler example of mean and median are the same in parametric analysis but not in nonparametric.
Beyond that, I think the sample sizes are way to small anyway…
In the big picture, perhaps the scientism in psychiatry is the child of the same scientism in evolutionary biology, which is based on a theory being used religiously as a premise, then being fashioned into a distorted and myopic lens with which to evaluate and/or justify or condemn everything human. This reductionist viewpoint gets wrapped up in pretty bows then offered to us as the pinnacle of pure and indisputable reason based on ’empirical’ evidence’; i.e, fudged numbers and subjective observations masquerading as ‘objectivity’ that can be measured (i.e., story telling they pull out of their butts with carefully crafted values and inventories to tilt the results in their favor).
Anyone who rejects that lens and/or its popular ubiquity rejects science and reason itself— no matter how idiotic, inadequate, or crooked some of the conclusions are on their face and how utterly barren the approach is— oye— what hubris.
We need more philosophers, more philosophers of science, and more philosophical scientists.
And more poetry.
No one who wants to get better needs Nemeroff.
http://www.evolutionnews.org/2014/07/national_academ_1088331.html
Wiley,
Unfortunately that describes much of academia in general right now. It’s not just psychiatric studies that are bad, but scientific studies of all kinds are at an all time low in terms of ability to be replicated.
I think there are just too many universities and too many people pretending to be serious when they just don’t have the tools. But careerism reigns.
I think people in the sciences aren’t getting proper training in critical thinking and, as you say, careerism reigns,
1st day of medical school ought to include lectures on the philosophy of science including Popper, Kuhn, et.al.
Many medical students and scientists think that if if an idea can’t be disproven the theory is strong, they need to understand the opposite is true.
I’m personally embarrassed by the fact I didn’t discover Meehl well into middle age.
I wish I had had the education that I got in college in high school, and since I’ve seen the demands of the liberal arts for undergraduates degraded to the point that in my last stint in college, no blue book tests were given. Multiple choice and fill in the blank, or one sentence answers typically only require recall, not thinking.
From a semi-retired psychologist: The small sample size is very troubling. They should have done a statistical power analysis to determine the appropriate sample size for this study. Plus, patient demographics are crucial if they want to generalize from the sample (aging patients?) to the general population (young, middle-aged, elderly). Were the four groups matched, in terms of age, gender, ethnicity, health status, etc? If not, then their statistical comparisons are biased.
Mark,
Your point has been noticed by others in medicine and they are questioning the “evidence” provided them by pharma and others.
http://www.medrants.com/archives/7842
Math aside you look at sample size and sample participants and logic dictates you question the results. I was educated BC (before computers) and we were taught that before you go to the trouble of doing the math, did the whole thing make sense.
Today with computer driven stat paks a marketing executive can play with the sample size, duration of the trial, or any other parameter and get the numbers he/she wants. The whole concept of science as above market manipulation goes out the window.
Wiley has noted how education now seems driven by cut and paste all supplied by Google. The internet does not lie, ask any 20 year old.
Steve Lucas
Steve, like you I was educated before computers (PhD in 1972) and learned the difference between research methods and statistics.With large enough samples, almost any difference will be statistically significant. The emphasis on statistical significance can mask fatally flawed research designs–leading to more and more junk science.
I was quite surprised when I was told that the V.A. would pay for acupuncture to relieve nerve pain. Had they decided that the placebo effect was good enough— if it worked, it worked? Then recently I read about RCTs being done to legitimize alternative medicines. With large studies (or enough large studies) they were able to find statistical significance in their treatments. Then Cochrane came along, went through the studies and determined that there was a significance, so now, RCTs— which are widely believed to be the holy pinnacle of “science”— are being used to support the use of useless, and sometimes dangerous (like chelation) therapies that are being recommended by committees so that they are included in some guidelines.
It’s sad to see medical science mocking itself like this.
There have been plenty of negative studies on this idea for decades but the grant money keeps pouring in:
http://bjp.rcpsych.org/content/150/6/791