I started the last post with a borrowed literary device, but I was just practicing. In The French Lieutenant’s Woman, John Fowles popped into his story and spoke in the first person with the reader. He did that, or at least claimed he did that, because he couldn’t decide how to end his novel. He ended up writing two endings. Well that’s my problem with this story. I’ve got two different endings, both of which matter to me, but they aim at substantively different conclusions and there’s no resolving them. So I’m just going to have two endings and be done with it. but first…
Thus, with one strong·ly positive trial and supportive evidence from two additional trials, there is adequate evidence of efficacy to approve this product for the adjunctive treatment of MDD.
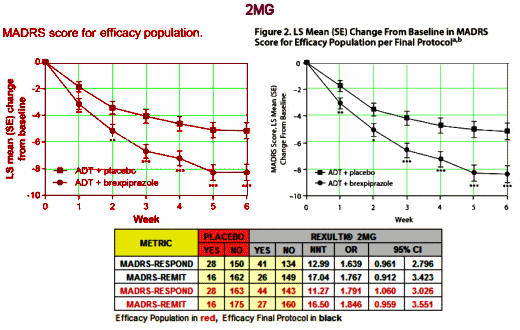
But is that what strong means? Very significant? We actually have other ways of looking at strong, called strength of effect or Effect Size. I mentioned them in in the land of sometimes[2]… and in the land of sometimes[3]…. The Primary Outcome Variable in these studies is the MADRS score at 6 weeks compared to baseline [a continuous variable]. The usual measure of Effect Size would be Cohen’s d, but they neither calculated it nor gave us enough parameters to do it ourselves. But they did use the MADRS score to tally Responders [≥ 50% reduction] and Remitters [≥ 50% reduction and ≤ 10]. So I looked to see how strong they were in the 2MG study. I found the NNT [Number Needed to Treat] and OR [Odds Ratio] for the original Efficacy Population and the Final Efficacy Protocol using their Table 2 and the Supplement:

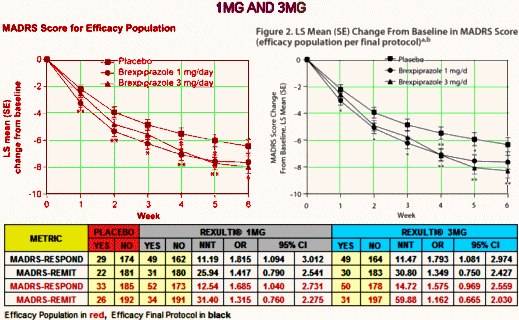
The NNT of 13 says that you have to treat 13 patients to get one that exceeds what you’d get with placebo alone. That’s a lousy number, on the other end of the scale from strong. It’s a weak if any effect. No matter which study you look at, or which population you use, these are all lackluster numbers. And the Odds Ratios consistently under 2.0 are low. Here’s the 1MG AND 3MG study, equally dismal:

You might notice that the graphs look better than the numbers. You can do that using a change from baseline scale that obscures the fact that the MADRS is a 60 point scale and then using the SEM for limit markers rather than the SD or the 95% CIs which might show how close these lines really are [I think of it as presentation spin].
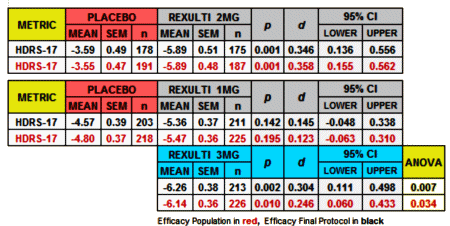
Since I couldn’t do the Cohen’s d for the MADRS scores, I had a look at the HDRS-17:

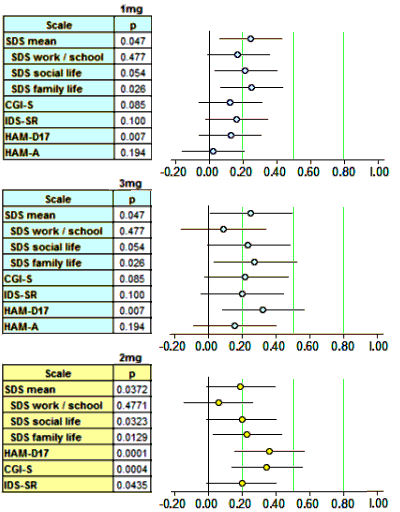
Finally, since I have a spreadsheet that converts the usual Mean, SEM, n figures into Effect Sizes [Cohen’s d AKA Standardized Mean Diffierence], I kept going and put in all of the continuous Secondary Outcome Variables for the two studies [recall d=0.2 is weak, d=0.5 is moderate, and d=0.8 is strong]:

Scanning down the forest plots, there’s nothing at all that I see justifying the strong moniker. Brexpiperazole just didn’t leave many footprints in the sand. And as Spielmans et al pointed out in their meta-analysis [the extra mile…], the self-reported depression scale [IDS-SR] is in the hardly-noticed range. Searching the text of the two articles, measurements of Effect Size are barely mentioned or reported. Certainly they play no important role in their analysis or discussion. So I’ll add that to my list of complaints about these papers.
Sorry, the comment form is closed at this time.