This is just some fluff. After all this time looking at the industry-funded clinical trials [RCTs], I’ve learned a few tricks for spotting the mechanics of deceit being used, but I realize that I need to say a bit about the basic science of RCTs before attempting to catalog things to look for. Data Transparency is likely coming, but very slowly. And even with the data, it takes a while to reanalyze suspicious studies – so to these more indirect methods. If you’re not a numbers type or you know your statistics, just skip this post. But if you want to become an amateur RCT vetter, read on. After a few more posts, there will be a summary and a guide to the Internet calculators to do the math. It’s something a critical reader needs to know something about.
As I said in
in the land of sometimes[1]… "the word
sta·tis·tics is derived from the word
state, originally referring to
the affairs of state. With usage, it has come to mean general facts about a group or collection, and the techniques used to compare groups. In statistical testing, we assume groups are not different [the
null hypothesis], then calculate the probability of that assumption." That post a month ago was about some of the basic statistical tests used to evaluate
continuous variables – where to variable studied can have any value. The
continuous variables are the numbers of arithmetic, with decimal values; the numbers for making smooth x-y graphs; the numbers of
parametric statistics. We talk about means, standard deviations, Student T-Tests, analyses of variance [ANOVA]. And in that post, we discussed
Cohen’s d as the value we often calculate to measure the Effect Size, the relative strength of the variable’s effect [see
in the land of sometimes[1]…]:
d = (μ1 – μ2) ÷ σ
"While there’s no strong standard for d like there is for p, the general gist of things is that: d = 0.25 [25%] is weak, d = 0.50 [50%] is moderate, and d = 0.75 [75%] is strong." This statistic is sometimes called the standardized mean difference.
In what I think of as the land of sometimes, mathematics are different than those we learned in high school [unless we took statistics] because any given variable is only sometimes true. The fixed meanings of pure mathematics disappear as we approach the inevitable variability in our measurements and in the nature of nature itself. So there are no absolutes, just likelihoods and probabilities [and no matter how improbable, it’s still possible to be dealt a poker hand with four aces – sometimes].
Not all parameters are continuous variables. Some are yes/no
categorical variables – based on some criteria, "did the patient respond to the drug or not". So we’ve introduced something new –
criteria – and we have to use an entirely different computational system to look at
Probability and
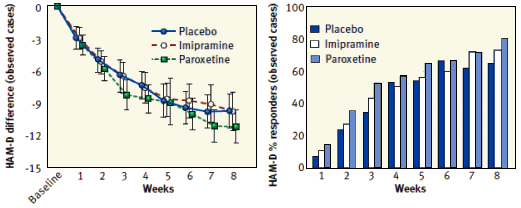
Effect Size with this kind of data. The visuals are even different. Here are two graphs adapted from our
Study 329 paper that show two different treatments of the HAM-D values – the difference from baseline on the left [a
continuous variable] and the response rate on the right [a
categorical variable] [with the
criteria being that a responder has a HAM-D score either
< 50% baseline
or < 8 and a non-responder has a HAM-D score both > 50% baseline
and > 8]:
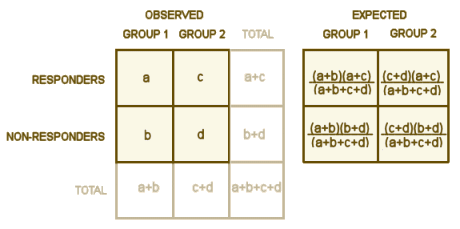
So if you have two groups and you know the sizes and the percent responding in each, that’s all you need. No means, no standard deviations, no assumptions about a normal distribution. The classic test is the Chi Square contingency table:
Fill in the numbers for a, b, c, and d. Use the totals to calculate the expected values [if you look at the formulas long enough, the why the expected values represent the null hypothesis of no difference? will become obvious]. Then compute a value for each of the four cells using…


… and add the four values to get the
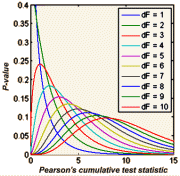
X2 test statistic If this were 1971, you’d take the test statistic and the degrees of freedom
[rows-1] × [columns-1] and look up the p value in a book of statistical tables. But it’s not 1971, it’s 2015. So you’ll forget all the calculating and use an Internet calculator like
vasserstats by simply filling in a, b, c, and d, and like magic the p values will just appear. There’s a
bigger calculator if you have more than two groups. There are some subtleties [
Pearson’s, Fisher’s, Yates’s] that I can’t keep quite straight myself from time to time, but they are easy and well explained on the
Wikipedia and
vassarstats pages. Thanks to the Internet, the
p value is just seconds away.
So what about the Effect Size with categorical variables? It’s just as important as it is for the continuous variables. There are two indices in common use: the number needed to treat [NNT] and the odds ratio [OR]. We use those same monotonous parameters [a, b, c, and d] to calculate their values. First, the formulas:
NNT = 1 ÷ (a÷(a+b) – c÷(c+d))
OR = (a÷(a+b)) ÷ (c÷(c+d)))
The NNT is the easiest to interpret [though the derivation isn’t so intuitive]. It’s the number needed to treat to get one responder you wouldn’t get with placebo. With the OR, it’s the easier to understand the logic, but harder to interpret. More about its values later [in an example]. One very important fact to always keep in mind about these statistics with categorical variables – what they measure is meaningless if you don’t know the criteria used to derive them [like above with "a responder has a HAM-D score either < 50% baseline or < 8 and a non-responder has a HAM-D score both > 50% baseline and > 8"]. Often you will read "The Odds Ratio for responders is…" but that’s not enough. You still need to know precisely how they defined and extracted "responders."
I said in
in the land of sometimes[1]… that I’d throw in these statistical interludes when it’s a rainy day with nothing going on. It’s not raining and there’s plenty happening, but I have a reason for both this post and the next. I really want to compare two meta-analyses of the same topic looking at mostly the same data, and I can’t do that without at least something of an introduction to some basic statistics, particularly Effect Sizes. For many reasons, we’re in an age of meta-analyses in psychiatry, so it seems an appropriate [as well as my trademark boring] thing to be talking about…


 … and add the four values to get the X2 test statistic If this were 1971, you’d take the test statistic and the degrees of freedom [rows-1] × [columns-1] and look up the p value in a book of statistical tables. But it’s not 1971, it’s 2015. So you’ll forget all the calculating and use an Internet calculator like vasserstats by simply filling in a, b, c, and d, and like magic the p values will just appear. There’s a bigger calculator if you have more than two groups. There are some subtleties [Pearson’s, Fisher’s, Yates’s] that I can’t keep quite straight myself from time to time, but they are easy and well explained on the Wikipedia and vassarstats pages. Thanks to the Internet, the p value is just seconds away.
Sorry, the comment form is closed at this time.