praying for perestroika

Posted on Sunday 10 January 2016

Being born in early December 1941 meant that I came in at the end of the last movie just when the next one was starting. And by the time I came into awareness, there were a couple of realities that for all I knew had always been in place – the Iron Curtain and the Cold War. So we played war with plastic soldiers in the dirt, pasted newspaper clippings of the jet fighters flying in Korea into scrapbooks, and had drills at school about how to hide from thermonuclear annihilation by getting under our desks. And except for things like the Cuban Missile Crisis, these things just faded into the background of life. And then there were signs of a thawing. In 1968, Alexander Dubçek became the President of Czechoslovakia and began to reform their Communist government, the Prague Spring. He allowed foreign travel, and my brother-in-law and his wife booked a trip, arriving a day or so before the Tanks from the Warsaw Pact invaded and put an end to Dubçek’s nonsense. After several nail-biting days holed up in a hotel, they were able to get on a train out of there.

I don’t recall ever giving much thought to how the Iron Curtain actually worked.  I’d seen the Berlin Wall and gone through Checkpoint Charlie for an afternoon. I guess I thought of it as something like that. And then one night, something remarkable happened. I had left Emory for private practice and our group [and secretary] were grossly dissatisfied with the only billing system that was available – a pegboard affair used by medical doctors. There wasn’t any billing software for a small session-based office like ours, so I set out to write some. I  wrote it in dBase-III+, the language of the day. It came out better than I could’ve imagined, but to run it you had to have dBase-III+ on your [DOS] computer and it was agonizingly slow. Then a company called Clipper released a compiler that turned dBase-III+ programs into standalones that were as fast as the wind by the standards of  the day. With that addition, I was beginning to sell my little program to people in the area, and I often spent my evenings on a message board Clipper had on Compuserve working out the inevitable bugs in such things. This was before the Internet. Well, the Internet was there, but Tim Berners-Lee hadn’t come up with his html language, there was no browser or world wide web, and Al Gore hadn’t invented the Information Highway [by alerting us that it was already there].

One night, all of a sudden, that message board lit up like a Christmas tree with entries. They were from a guy in a store-front office in Moscow who was in Russia trying to establish a Clipper presence [it was Gorbachev’s time and Russia was experimenting with perestroika – literally restructuring]. This Clipper guy was typing as fast as he could. Something was happening. The streets were full of people. The Tanks were rolling. He thought maybe he saw Boris Yeltsin with the crowd. I yelled downstairs for my wife to turn on CNN. They didn’t know as much as I did reading this guy’s green screen messages [which went on all night]. That unrest in Moscow spread like a wildfire throughout the USSR and the rest is history. Down came the Iron Curtain.

I think that was the first time I really understood what the term, Iron Curtain, actually meant. It wasn’t made of bricks and mortar. It was control over the free flow of information in, out, and within the USSR, and it persisted from the end of World War II until the days I’m talking about – nearly half a century. Afterwards, all kinds of explanations for why the curtain fell circulated – Reagan’s rhetoric, the Internet, etc. But that was before there were PCs everywhere using the Internet. I was later told by someone who ought to know that the real chink it the armor turned out to be the fax machines that were, by then, everywhere. As soon as things started happening in Moscow, news was flying all over the USSR on the ubiquitous fax machines. Whatever the truth, the point is that the Iron Curtain finally came down when the Soviets lost control over the flow of information.

If you haven’t figured out the analogy I’m about to make, wipe the sleepy dust out of your eyes and think about the pharmaceutical industry’s hold on the raw clinical trial data that’s the everyday topic here and elsewhere. It’s more than just an analogy, it’s a direct application out of Stalin’s playbook for holding onto his power. By taking advantage of the low efficacy standard for FDA Approval of a drug and publishing "uncheckable" articles in the medical literature, the companies can turn a weak statistical proof of a drug’s [perhaps trivial] effect into a campaign worth billions.

Until we have that kind of free data access, the only thing I know to do is to whine, and to try to interest as many people as possible in learning how to use what tools are available to vet clinical trial articles themselves. So back to the business of john henry’s hammer…
Mickey @ 12:34 PM

inkblot?…

Posted on Saturday 9 January 2016


Psychiatrist Set Rigorous Standards for Diagnosis
New York Times
By Benedict Carey
December 26, 2015
Architect of the DSM
Psychology Today
By Edward Shorter
December 28, 2015
The Psychiatric Legacy of Robert Spitzer
Mad in America
By Bonnie Burstow, PhD
January 05, 2016
The most influential psychiatrist of his time
Huffington Post
By Allen Frances
January 08, 2016
On rereading, I realized that my comments after Dr. Spitzer’s death [persists in memory…] weren’t necessarily about Dr. Spitzer, but rather about what I saw as several  negative consequences of the DSM-III he shepherded – the diagnosis Major Depressive Disorder that conflated categorically unrelated conditions and the consolidation of power in the American Psychiatric Association. In a way, I was using him as an inkblot to say things I feel strongly about. And reading these other commentaries, I’m not alone in that kind of projection. In the interim, something occurred to me that may or may not relate to him specifically, but at least it’s not just a surrogate for some pre-existing idea. Here are a few quotes from his Introduction to the DSM-III:
    [1] "The approach taken in DSM-III is atheoretical with regard to etiology or pathophysiological process except for those disorders for which this is well established and therefore included in the definition of the disorder. Undoubtedly, with time, some of the disorders of unknown etiology will be found to have specific biological etiologies, others to have specific psychological causes, and still others to result mainly from a particular interplay of psychological, social, and biological factors…"
    [2] "Since in DSM-I, DSM-II, and ICD-9 explicit criteria are not provided, the clinician is largely on his or her own in defining the content and boundaries of the diagnostic categories. In contrast, DSM-III provides specific diagnostic criteria as guides for making each diagnosis since such criteria enhance interjudge diagnostic reliability. It should be understood, however, that for most of the categories the diagnostic criteria are based on clinical judgement, and have not yet been fully validated by data about such important correlates as clinical course, outcome, family history, and treatment response. Undoubtedly, with further study the criteria for many of the categories will be revised…"
    [3] "The purpose of the DSM-III is to describe clear descriptions of diagnostic categories in order to enable clinicians and investigators to diagnose, communicate about, study, and treat various mental disoders. The use of this manual for non-clinical purposes, such as determination of legal responsibility, competency or insanity, or justification for third party payment, must be critically examined in each instance within the appropriate institutional context…"
    [4] "In the several years it has taken to develop DSM-III, there have been several instances when major changes in initial drafts were necessary because of new findings. Thus, this final version of DSM-III is only one still frame in the ongoing process of attempting to better understand mental disorders."
I’ve always taken [1] as sincere. If you know Spitzer’s personal history, he was no stranger to matters psychological. His crusade against psychoanalysis was directed at the body psychoanalytic and the hegemony of psychoanalytic theorizing, not an opposition to the impact of personal biography on the psyche. He’d lived through that himself. He wanted psychiatry to fill in the many unknowns in causality based on hard data and evidence rather than what he saw as speculation. And as for [3], he was whistling in the wind. The actuaries knew the DSM-III long before many of us did. It was the time of DRGs [Diagnostic Related Groups] and the "use of this manual for non-clinical purposes, such as determination of legal responsibility, competency or insanity, or justification for third party payment…" flourished whether intended or not.

In [2], he says that the specific diagnostic criteria were added as guides "since such criteria enhance interjudge diagnostic reliability." Inter-rater reliability, as measured by Kappa, was his front-line organizing principle [A Re-analysis of the Reliability of Psychiatric Diagnosis, 1974]. I can easily imagine him saying, "But if we don’t provide criteria for these diagnoses, the inter-rater reliability is going to hell in a hand-basket! They’ll be all over the place just like with the DSM-II." Throughout these comments, it’s easy to see that he was trying to create a diagnostic system that would iterate and evolve"only one still frame in the ongoing process of attempting to better understand mental disorders."

That’s not what happened. His "one still frame" hung around for a long time frozen in time [like into the present]. It didn’t iterate and evolve,  nor did it function as a guide. A year or so after it was released, I was belatedly taking my psychiatry oral board exam in far-off Texas. I had postponed air travel for a few years because of a back problem, and so I was in a cohort of recent graduates from all over the country much younger [and greener] than I. On the bus to the hospital for the exam, they were frantically quizzing each other about these criteria which they had memorized. I thought if that’s what it was going to take to pass the test, I was going to be left in the dust. Fortunately, my examiners were more my age, and the patient I examined was a lonesome cowboy who was depressed for some really good lonesome cowboy reasons. But my point is that these criteria weren’t being seen as guides, they were quotes from a book soon to be dubbed "the Bible of Psychiatry."

And while I believe Dr. Spitzer thought it was "atheoretical" [1],  in the most public circles, it was "a" "theoretical" piece of work – and we all know which "theory".  I’ve never read anything much in our literature seriously proposing a psychological or a psycho-social etiology for any DSM-III category. We just stopped talking about that and by the time Prozac came on the scene in 1987, psychiatry was off-and-running towards a later time [2002] when the DSM-5 Task Force was launched with its eyes on the prize of adding biological markers to the manual and realizing the neoKraepelinian dream. So if I believe what Dr. Spitzer said in that Introduction [which I do], why didn’t it iterate and evolve? Why did those tentative guide criteria remain mostly unchanged [set in concrete]? Why when he seems to be standing on his head to say these are categories and not diseases is the main argument with others about the medical model of disease? I actually think those are pretty good question.

And so to my later thought. Was there something about the way Dr. Spitzer went about creating the DSM-III that turned it from a guide into "the Bible of Psychiatry"? from tentative to immutable? Or was that something that had to do with other forces? I find it hard to believe that someone who had his finger in every single piece of that revision was a just a neutral figure in all that has happened since. But those are questions I don’t know the answers to – much more interesting to think about than projecting what I already think onto a Rorschach card with his picture on it…
Mickey @ 9:00 PM

john henry’s hammer: an interim summary…

Posted on Friday 8 January 2016

In a way, what I’m trying to do here is at cross purposes with some of my own beliefs. Short term Randomized Clinical Trials [RCTs] can tell us whether a drug has the desired medicinal properties; something about the strength of those properties; the incidence of early adverse effects; and can identify some but certainly not all serious toxicity. Long term trials, the experience of practicing clinicians, and the reports of patients taking these drugs are a much more important source of ongoing information. Our system of drug development and patenting has created a situation where the early clinical trials are way overvalued during the in-patent period [even the "good ones"], and often the medication harms are suppressed until they emerge in legal actions late in the day – after the damage has already been done. In addition, the early RCTs are industry productions, and many of them have made mincemeat of the scientific method they’re meant to represent.  So I’m focusing on the efficacy testing of short term RCTs when we all know that the most important thing is the long term harms. But I base that approach on the medical principles of preventive medicine, specifically secondary prevention – early detection and rapid intervention. I know that the ultimate answer is Data Transparency and Independent Trial Analysis, but until that happens, educating as many people as possible about how to evaluate these early trials seems an essential way to intervene in the present…

The a priori Protocol:
A randomized, placebo controlled, double-blinded clinical trial [RCT for short] is not exploratory research. It’s more in the range of product testing. And its validity rests on a formal declaration of the details of how the study will be conducted and specifically what measurements will be taken, what will be the primary [and secondary] outcome variables, and how the data will be analyzed. The phrase a priori means before the study begins. We can never count on the sanctity of the blinding. People peek. But we can trust a formal Protocol filed before the study starts. So step one in evaluating a study is to get the Protocol, or as close to the Protocol as possible. That information should be in the article, but if it’s unclear, you can often get at it from the information on clinicaltrials.gov. I’ve yet to see a study where the Protocol was changed in midstream that didn’t smell like three day old fish. Likewise, if you can’t figure out what the Primary and Secondary Outcome Variables are, be suspicious of the whole enterprise.

Since we don’t have the luxury of seeing the raw data, we have to rely on Summary Data. In the case of Continuous Variables, that includes the MEAN, either the Standard Deviation or the Standard Error of the Mean, and the Number of subjects [μ, σ or sem, and n]. In groups of sufficient size [>30], those three parameters are a reasonable proxy for the datasets. If the Summary Data is provided in the article, the task of quickly vetting a Continuous Variables is straightforward. Again, if you can’t figure out what the Summary Data is, be suspicious of the whole enterprise:

  • STEP 1: The OMNIBUS Statistic:
    If there are more than two groups [eg placebo+several drugs, placebo+several doses of a drug, etc], the first order of business is  to test the significance of the whole dataset with an analysis of variance [often called the Omnibus Statistic]. With Summary Data, one can use the Internet Calculator provided on John C. Pezzullo’s statpagesAnalysis of Variance from Summary Data [see john henry’s hammer: continuous variables II…]. If the result is not significant, that means that the group’s variances are not different from the whole dataset’s variance, and no further testing is required. The study is negative for the tested variable – end of story. Even if STEP 2 produces pairwise significance, it is meaningless. There are plenty of studies that skip this step [notably Paxil Study 329]. Off-hand, I can think of no valid reason to skip it.
  • STEP 2: SIGNIFICANCE testing:
    With Summary Data, the Pairwise Comparisons [placebo vs drug1, placebo vs drug2, drug1 vs drug 2] is also straightforward. There are any number of Internet Calculators that produce the same results. I recommended GraphPad QuickCalcs because I like the interface [see john henry’s hammer: continuous variables I…]. The p-values are also invariably given in the article. Remember that p, the probability, is qualitative. Comments like "almost significant", "very significant", "just barely significant" are common – and meaningless.
  • STEP 3: EFFECT SIZE testing:
    The various EFFECT SIZES are mathematical indices aiming to quantify the effect of a drug – its strength. The most common index with Continuous Variables is Cohen’s d – the difference between the two Means expressed as a function of the Standard Deviation – also called the Standardized Mean Difference [SMD]. It is usually reported with its 95% Confidence Interval. I recommended using Psychometrica‘s Comparison of groups with different sample size (Cohen’s d, Hedges’ g). While one uses the same parameters as those used for significance testing, the Effect Size estimates add a quantitative dimension to the results. This is often omitted from published papers. So at the end of STEPs 1-3, you will have a table that looks like this – plenty enough information for an informed opinion:
    BREXPIPRAZOLE Trials in Schizophrenia


    STUDY DRUG MEAN SEM σ n p d lower upper anova p
    Correll
    et al
    placebo -12.01 1.60 21.35 178 0.0002
    0.25mg -14.90 2.23 20.80 87 0.3 0.14 -0.120 0.393
    2mg -20.73 1.55 20.80 180 <0.0001 0.41 0.204 0.623
    4mg -19.65 1.54 20.55 178 0.0006 0.36 0.155 0.574
    Kane
    et al
    placebo -13.53 1.52 20.39 180 0.0025
    1mg -16.90 1.86 20.12 117 0.1588 0.166 -0.067 0.399
    2mg -16.61 1.49 19.93 179 0.1488 0.153 -0.054 0.360
    4mg -20.00 1.48 19.91 181 0.0022 0.321 0.113 0.529
  • STEP 2 and 3: SPREADSHEET shortcut:
    I made a simple spreadsheet that creates this table [except for STEP 1] just by entering the Summary Data to speeds things up a bit. It’s downloadable here.

If the Summary Data isn’t provided, but the paper has the sample sizes and a p-value [p, n1, and n2], there is a way to extract the EFFECT SIZES. That shouldn’t happen, but it does. The procedure involves two Internet Calculators. The first converts the p-value into it’s z-score. You have to divide the p-value you’re given by two and then enter the result into John Walker’s Internet Calculator to extract the z-score – then enter that z-score and the sum of the sizes of the groups being compared into Psychometrica‘s Computation of the effect sizes d, r and η2 from χ2- and z test statistics. And out comes Cohen’s d as if by magic! The Confidence Intervals can be generated with d, n1, and n2 and a ponderous formula:

CI[95%]=d±1.96×√(((n1+n2)÷(n1×n2))+d²÷(2 ×(n1+n2)))

[see john henry’s hammer: continuous variables III…]. I expect this ponderous formula will be automated on a spreadsheet coming soon to a blog near you. Thus ends my summary of the discussion of Continuous Variables. How to interpret that table comes at the end of this series. On to the Categorical Variables…

In spite of an earlier career in hard science and a lot of statistical training and experience in a Jurassic Era, when I retired in 2003, I didn’t know how to do any of this. Worse, I didn’t even know it was there to do. I had moved in other directions and was a practicing psychotherapist by the time the IBM PC came along, or the Internet. I spent a lot of time with both, but it wasn’t doing this kind of thing. This looking at RCTs came after retirement and required a lot of catching up and pestering some very patient teachers to whom I will be eternally grateful. Back in the day, before I left Academia in the wake of the DSM-III, I had a job I loved – one I would’ve gladly done until retirement. I directed a Residency Training Program in Psychiatry. Having done three training programs myself, I know you never learn as much as you do in those first few years, and I loved being a part of that process and teaching the residents. It was a real loss to leave it. I guess I must still be at it in a way, because that’s where these posts are aimed. I’m trying to put together the collection of basic skills and simple tools that I wish I’d had in training or taught my residents. Back then, I would never have imagined that I would need to know how to spot deceit, sleight of hand, or sophisticated spin in the medical literature on a regular basis. But that’s the modern reality. And so that’s what I’m trying to work out in these posts. What does the new trainee need to learn out of the gate to prevent this kind of thing being perpetuated or repeated?  Any and all help with that or suggestions appreciated…
Mickey @ 11:30 PM

john henry’s hammer: continuous variables III…

Posted on Thursday 7 January 2016

Alice's Restaurant - Arlo Guthrie 1967Generally, folk heros are from the past like John Henry and represent some laudable principle – like man versus machine. Back in the upside-down years of the 60s, Arlo Guthrie had a shot with his endless comical antiwar song, Alice’s Restaurant. The premise, however, was dead serious. When enough people get behind a needed change, that’s when things finally happen. We’ve seen some of that with Data Transparency and distorted Clinical Trial reports alread [though not near enough].

I happen to agree with Arlo that the hard work of righting a wrong is in keeping it on the front burner [as in the Civil Rights Movement, Women’s Rights, Gay Rights], and the distortion of the scientific record by corruptly reported Clinical Trials is a wrong of sufficient magnitude to dog until it’s past history. While Psychiatry lead the pack there for a while, it’s a problem throughout medicine that needs our full attention – and I personally have come to believe that without Data Transparency, it will never happen. One of the major frustrations with these journal articles is that you can’t get at the data itself to evaluate things yourself, at least that’s been my major frustration. Even if you have an academic connection that allows you access to the articles themselves rather than just the abstracts, they often omit key parameters that would allow you to get under the carefully crafted rhetoric even with the crude tools described in the first two john henry’s hammer posts to see what’s going on.

I’ve been monotonously preoccupied with the most recent arrival on the psychiatric scene, Brexpiprazole [Rexulti®] acting on the principle of early detection – if there’s something awry, the sooner it’s exposed the better. Looking at their Schizophrenia data, the papers are ghost-written industry productions sure enough, but they give us enough information to do a reasonable elm-tree mechanic vetting. It’s a middle-weight antipsychotic, a clone of the blockbuster Aripiprazole [Abilifyi®]. But when I look at the two articles introducing it as an adjunct for augmenting antidepressants in treatment resistant depression [for which it also has FDA Approval!], it’s a different story. First off, there’s the sleight of hand Protocol infraction [see income switching…] that I’m going to reject with no more comment and look only at the original Protocol [they call it the efficacy population]. But when I go looking for the summary data on the primary outcome variable [change in MADRS score at 6 weeks], here’s all I find:

"Mean change in MADRS total score for the efficacy population also showed improvement for brexpiprazole 3 mg versus placebo (−1.52; 95% CI, −2.92 to −0.13; P = .0327) but did not reach the level of statistical significance required for multiple comparisons according to the prespecified statistical analysis. The mean improvement for brexpiprazole 1 mg versus placebo was less than that for 3 mg (−1.19; 95% CI, −2.58 to 0.20; P = .0925)."

from Efficacy and safety of adjunctive brexpiprazole 2 mg in major depressive disorder: a phase 3, randomized, placebo-controlled study in patients with inadequate response to antidepressants.

"Similar results were seen for brexpiprazole versus placebo in the efficacy population (LS mean = −8.27 vs −5.15; LS mean difference =−3.12 [95% CI, −4.70 to −1.54], P = .0001)."

They give us all the summary data we could ever want on all of their secondary outcome variables, but not the primary outcome variable in either article [a μ or so with the "good article," but no SEM or σ]. So I went to the FDA Medical Report, hoping that since they approved the drug for this indication, they would give us more. No such luck. Maybe I missed something [and I’d appreciate someone else taking a look], but I ended up with a table that was barely populated and a mighty lonely spreadsheet:

BREXPIPRAZOLE Trials Augmenting Treatment Resistant Depression


STUDY DRUG MEAN SEM σ n p d lower upper
Thase
et al
placebo  –  –
 218  –

 –
1mg        225  0.0925      
3mg       226
 0.0327      
Thase
et al
placebo -8.27
 –
 191
 –  –
2mg -5.15
     187 0.0001
     

Instead, they give us the difference between the means…

1–μ2)

and the 95% confidence limits – the formula for that is:

CI[95%]=(μ1–μ2)±1.96×√((σ1²÷n1)+(σ2²÷n2))

There’s just no way I can figure to deconstruct those values, work it backwards, and end up with the summary data [even though I know they had it and used it to generate something I didn’t particularly want]. In the two articles, they give us four tables of summary data for secondary outcome variables – two with their jury-rigged numbers in the articles and two with the real numbers in the supplements, but for their declared primary outcome variables, slim pickings.

Admittedly, some claim that reporting the difference in the MEANs is an Effect Size and don’t convert it to a Standardized MEAN Difference [Cohen’s d], but I’m not in that particular some [and they aren’t either, since the same people didn’t do that in their Schizophrenia articles from the same company with the same ghost-writing firm – even reporting the Cohen’s d in their best showing article]. So what’s a fellow who’s trying to write a guide for other elm-tree vetters going to do in this situation? Is John Henry’s Hammer dead in the water? I say where there’s a will, there’s a way. Stay tuned.


When I read Spielmans et al’s meta-analysis of the augmentation with Atypical Antipsychotics in treatment resistant depression [see the extra mile…], I ran across these lines:

"The quality of data reporting varied across studies. For continuous outcomes, effect sizes were computed from means and standard deviations when possible. When these were not provided, effect sizes were computed based on means and p-values, or p-values only."
Having lost some hair over the absence of complete summary data in a number of papers, I was intrigued. So I wrote Glen Spielmans and he got right back to me with good news and bad news. The bad news was expensive software [Comprehensive Meta-Analysis Software]. The good news was a link, but mostly the conviction that there was an answer. I had looked in my handy Cochrane Handbook for Systematic Reviews and Interventions and found this [page 182 of the book version]:
7.7.7.2 Obtaining standard errors from confidence intervals and P values: absolute (difference) measures
… The first step is to obtain the Z value corresponding to the reported P value from a table of the standard normal distribution. A standard error may then be calculated as
SE = intervention effect estimate/Z.
As an example, suppose a conference abstract presents an estimate of a risk difference of 0.03 (P = 0.008). The Z value that corresponds to a P value of 0.008 is Z = 2.652. This can be obtained from a table of the standard normal distribution or a computer (for example, by entering =abs(normsinv(0.008/2) into any cell in a Microsoft Excel spreadsheet). The standard error of the risk difference is obtained by dividing the risk difference (0.03) by the Z value (2.652), which gives 0.011.

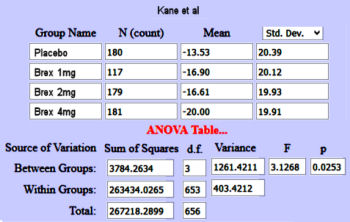
Still a little heady for John Henry’s hammer, but promising. The Z value is the area under the normal distribution curve used to compute p-values. But while looking around about the Z value, I ran across the Mother Lode – Psychometrica, a German web site tailor made for my purposes. It has an Internet Calculator that takes the Z value and the sample size [n1+n2] and out comes Cohen’s d. And on top of that, I found another Internet Calculator that produces a Z Score from a p-value [remember, you have to divide the p-value by 2 first!] requiring neither tables nor spreadsheet visits. So, armed with my two new calculators, I decided to try it out first on something where I had arrived at Cohen’s d and the CI[95%] by other means. So, back to the Brexpiprazole in Schizophrenia Trials [truncated with the new stuff in green]. You’ll note that I’m using my p-values rather than the ones in the articles because one of theirs appears to be in error [Kane 1mg], and that I changed the  sign on Cohen’s d and the CI[95%] :

BREXPIPRAZOLE Trials in Schizophrenia


STUDY DRUG n p d lower upper Z n1+n2 new d
Correll
et al
placebo 178
0.25mg 87 0.2976 0.137 -0.120 0.393 1.0146 265 0.128
2mg 180 0.0001 0.414 0.204 0.623 3.8906 358 0.420
4mg 178 0.0007 0.365 0.155 0.574 3.3896 356 0.365
Kane
et al
placebo 180
1mg 117 0.1629 0.166 -0.067 0.399 1.3951 297 0.162
2mg 179 0.1488 0.153 -0.054 0.360 1.4438 359 0.153
4mg 181 0.0025 0.321 0.113 0.529 3.0233 361 0.322

I agree with John Henry and Arlo! Those numbers are close enough for elm tree work in my book! I had no clue if this would pan out, so my hat’s off to the Calculator makers. Why do you divide by two? For that matter, how does it work? I don’t know those answers yet. Magic?

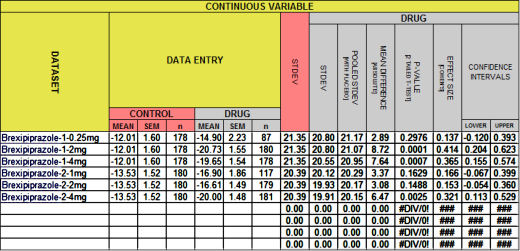
So moving right along – What about that other dataset where I didn’t know the the Effect Sizes? [The CI[95%] are from the formula in john henry’s hammer: continuous variables I…. This one’s also truncated with the new stuff in green]:

BREXPIPRAZOLE Trials Augmenting Treatment Resistant Depression


STUDY DRUG n p Z n1+n2 d lower upper
Thase
et al
placebo  218
1mg  225  0.0925 1.6824 443 0.160 -0.027 0.347
3mg 226  0.0327 2.1357 444 0.204 0.017 0.390
Thase
et al
placebo  191
2mg  187 0.0001 3.8906 378 0.409 0.205 0.613

I doubt if anyone is much surprised that the 3mg dose in that first study had a trivial Cohen’s d – right near inert. Why else would they make it so hard to generate it? But when you take away the Protocol sleight of hand and look at the Effect Size of 0.204, that p-value of 0.0327 doesn’t look very impressive at all. And that’s the point. Of course p and d are still just numbers. But adding the Effect Size [d] to the mix definitely deepens our understanding of the reported values well beyond the p-value. If the authors don’t give an Effect Size, and the editors don’t insist on an Effect Size, we need to be able to easily generate it ourselves.

As much as I’d like to rale at the FDA for that Augmentation Approval, or run down the internal workings of these last two Internet Calculators, my goal was to provide a way to vet studies by adding the Effect Sizes even if they withheld the summary values – and I think I’ve either done it or am close enough to take a breather. My mathematico-statistico-html-table-formatting libido is all used up for today…
Mickey @ 4:13 PM

john henry’s hammer: continuous variables II…

Posted on Wednesday 6 January 2016

I got a bit garbled at the end of the last post, so let me start over. I’ve been looking at these two studies, each of which have four groups – placebo and three doses of medication. My table shows three pairwise comparisons in two articles – placebo vs each dose of Brexpiprazole: The results from my simple spreadsheet are nearly identical to those published in the two papers [with one exception discussed later]. But from a statistical point of view, I’ve skipped a step – one that’s often skipped in published RCTs. I have not tested the whole dataset to see if these four grouping are indeed significant [valid]. The null hypothesis is that they aren’t, but rather an arbitrary grouping that doesn’t differ from the overall dataset. The traditional test to verify that there is a statistical basis for this grouping is called a one way anova. If we can’t reject this null hypothesis, the pairwise comparisons are meaningless, no matter how they come out.

BREXPIPRAZOLE Trials in Schizophrenia


STUDY DRUG MEAN SEM σ n p d lower upper
Correll
et al
placebo -12.01 1.60 21.35 178
0.25mg -14.90 2.23 20.80 87 0.3 0.14 -0.120 0.393
2mg -20.73 1.55 20.80 180 <0.0001 0.41 0.204 0.623
4mg -19.65 1.54 20.55 178 0.0006 0.36 0.155 0.574
Kane
et al
placebo -13.53 1.52 20.39 180
1mg -16.90 1.86 20.12 117 0.1588 0.166 -0.067 0.399
2mg -16.61 1.49 19.93 179 0.1488 0.153 -0.054 0.360
4mg -20.00 1.48 19.91 181 0.0022 0.321 0.113 0.529

So how can we do an anova in the absence of the actual data? Again, Internet Calculator to the rescue! Specifically retired Georgetown statistician John C. Pezzullo’s statpages has [among many other wonderful things] this one – Analysis of Variance from Summary Data. This just-what-the-doctor-ordered calculator takes as input the MEAN, either the SD or SEM, and n, and here’s what you end up with [reformatted for clarity]:

[Note: I checked this with a situation where I had actual data and it was right on the money!] So add this tool to the toolbox [and read his helpful explanation]. Now our table grows a column:

BREXPIPRAZOLE Trials in Schizophrenia


STUDY DRUG MEAN SEM σ n p d lower upper anova p
Correll
et al
placebo -12.01 1.60 21.35 178 0.0002
0.25mg -14.90 2.23 20.80 87 0.3 0.14 -0.120 0.393
2mg -20.73 1.55 20.80 180 <0.0001 0.41 0.204 0.623
4mg -19.65 1.54 20.55 178 0.0006 0.36 0.155 0.574
Kane
et al
placebo -13.53 1.52 20.39 180 0.0025
1mg -16.90 1.86 20.12 117 0.1588 0.166 -0.067 0.399
2mg -16.61 1.49 19.93 179 0.1488 0.153 -0.054 0.360
4mg -20.00 1.48 19.91 181 0.0022 0.321 0.113 0.529

Not bad for data analysis in the absence of data. What’s missing? Well there’s a lot. With packages like SAS, SPSS, R, and data [a big and!], for example, we could do a formal ANCOVA [a general linear model which blends ANOVA and regression] and partition the variance looking at any number of covariates or confounds that might be affecting the outcome. In this case, I’d like to explore the effect of having so many sites. They did that in this article, though their description of the statistical analysis is unnecessarily unintelligible to me. But my little table is enough to be able to make some independent judgements and even compare the results to other studies [see in the land of sometimes[5]…].

Unfortunately, the summary data [MEAN, either the SD or SEM, and n] isn’t always provided in the published articles [though by all rights it should be]. What can we do then? Stay tuned. The Internet hasn’t yet given up all of her secrets!…
Mickey @ 9:18 AM

john henry’s hammer: continuous variables I…

Posted on Tuesday 5 January 2016

John Henry was an American Folk Hero. He was a steel driving man in the era when they laid the railroad lines by hand. In one version of the legend, when they introduced a steam-driven hammer to cut the tunnels, John Henry and the new-fangled machine were pitted against each other. John Henry won with his hammer, but then He laid down his hammer and he died, Lord Lord. He laid down his hammer and he died

That’s the situation for most of us vetting the modern industry-funded Clinical Trials. The company statisticians have PhDs and use powerful [and expensive] software like SAS or SPSS running Linear and General Linear models capable of sophisticated analyses. We’re like John Henry, armed with only a computer calculator, a spreadsheet program, and scattered Internet Calculators – oh yeah, they have the data and we have only the proxies that we can gather from the published papers.

Frankly, I don’t know how many clinicians even want to know how to evaluate the reported findings in these clinical trial articles themselves. The waves and raves of psychopharmacology that started decades ago are finally on the wane, so the period when such skills would be of general use may be passing. But I think I see it as Continuing Medical Education. We’re already in an era where data of all kinds is a part of our daily medical practice – with the electronic medical records, the "Os" [HMOs, PPOs, etc], and population studies, data comes from every direction. Sailing between the Scylla of cost containment and the Charybdis of profit-based medicine will become increasingly difficult without a practiced intuition about all kinds of data and data processing. So I’m inclined to continue to pass on the few tricks of the trade that have been handed over to me in these last few years. To borrow a term from some of my colleagues in the recent Study 329 project, it’s just part of the healthy skepticism that should accompany any medical career. And the term evidence-based medicine is meaningless if you’re not fluent in the ways and means of evaluating evidence for yourself. Here are a couple of methods if you don’t already have some:

METHOD 1 – the spreadsheet:

    So, for starters, here’s a simple spreadsheet I made a couple of years ago that’s been helpful along the way. You can download it for your own use by clicking here. You can save it to your download folder, or open it and then save it wherever you want [it’s a small file – about the size of a graphic]. If you’re not spreadsheet literate or don’t have one on your computer, go down the page to METHOD 2 – the calculators]:

    If it looks familiar, it’s what I used to fill in the empty spaces in the table in in the land of sometimes[5] from the Brexpiprazole trials in Schizophrenia. This one:

    BREXPIPRAZOLE Trials in Schizophrenia


    STUDY DRUG MEAN SEM σ n p d lower upper
    Correll
    et al
    placebo -12.01 1.60 21.35 178
    0.25mg -14.90 2.23 20.80 87 0.3 0.14 -0.120 0.393
    2mg -20.73 1.55 20.80 180 <0.0001 0.41 0.204 0.623
    4mg -19.65 1.54 20.55 178 0.0006 0.36 0.155 0.574
    Kane
    et al
    placebo -13.53 1.52 20.39 180
    1mg -16.90 1.86 20.12 117 0.1588 0.166 -0.067 0.399
    2mg -16.61 1.49 19.93 179 0.1488 0.153 -0.054 0.360
    4mg -20.00 1.48 19.91 181 0.0022 0.321 0.113 0.529

    As most of you already know, the cells in your spreadsheet program [I use the free Open Office Calc] can hold one of three things: a number, some text, or a formula that shows the results of operations on the data in other cells. So the seven columns on the left are just empty cells for Data Labels and Data Entry. The eight cells on the right hold formulas that compute the results.

    Here’s what they hold [from left to right]:

    • The two columns labeled STDEV calculate the Standard Deviations using the MEAN and SEM [Standard Error of the Mean] for the CONTROL and DRUG respectively. Articles usually report the Standard Error [se  or  sem] rather than the Standard Deviation [sd  or  σ]. But it’s easily converted using the formula:

      sem = σ ÷ √n    or    σ = sem × √n

    • For what comes next [POOLED STDEV], we combine these two σs [σ1 and σ2] into a pooled σ using the formula:

      σ = √((σ1²×(n1-1)+σ2²×(n2-1))÷(n1+n2-2))

    • And the column labeled MEAN DIFFERENCE is just what it says – the absolute value of the difference between the CONTROL and DRUG MEANs.
    • The column labeled P-VALUE uses the two sample sizes, the POOLED STDEV, and the MEAN DIFFERENCE plus a built-in T-Distribution function to come up with the P-VALUE [just a bit of spreadsheet magic].
    • The EFFECT SIZE column is the absolute value of the MEAN DIFFERENCE divided by the POOLED STDEV ergo Cohen’s d.
    • And finally, the last two columns are the 95% Confidence Intervals for the EFFECT SIZE, derived from the EFFECT SIZE and the two sample sizes with a mouthful of a formula [from atop Mount Sinai]:

      CI[95%]=d±1.96×√(((n1+n2)÷(n1×n2)) + d²÷(2 ×(n1+n2)))

    That’s it. Here’s the good part. You never have to think about what’s in those formulas again – ever.

METHOD 2 – the calculators:

    • Converting the Standard Error of the Mean to the Standard Deviation is just too easy for anyone to make a calculator that  I could find. So you’re on your own. The formulas:

      sem = σ ÷ √n    or    σ = sem × √n

    • For finding the p-value from the Mean, number of subjects, and either the Standard Deviation or the Standard Error of the Mean, I use GraphPad QuickCalcs. It’s self explanatory.
    • For calculating Cohen’s d and its 95% Confidence Limits,  I am using Psychometrica [Comparison of groups with different sample size (Cohen’s d, Hedges’ g)]. It’s self explanatory too.
    • So I used them to fill in the table. Note: In the table above, only  the values in red are from the spreadsheet. The rest are from the articles. In the table below, all the ones in blue were calculated using the Internet Calculators:
    BREXPIPRAZOLE Trials in Schizophrenia


    STUDY DRUG MEAN SEM σ n p d lower upper
    Correll
    et al
    placebo -12.01 1.60 21.35 178
    0.25mg -14.90 2.23 20.80 87 0.2976 -0.137 -0.393 0.120
    2mg -20.73 1.55 20.80 180 0.0001 -0.414 -0.623 -0.204
    4mg -19.65 1.54 20.55 178 0.0007 -0.365 -0.574 -0.155
    Kane
    et al
    placebo -13.53 1.52 20.39 180
    1mg -16.90 1.86 20.12 117 0.1629 -0.166 -0.399 0.067
    2mg -16.61 1.49 19.93 179 0.1488 -0.153 -0.360 0.054
    4mg -20.00 1.48 19.91 181 0.0025 -0.321 -0.529 -0.113

So finally for just a few miscellaneous matters – one of which is actually important and the reason this post is here. The important one first:

  • [revised for clarity] In all the posts I’ve made about Brexpiprazole, no-one has noticed that the versions I’ve been showing in these tables have something missing. And it’s an error that is repeated in article after article. I’m showing pairwise statistics on two studies, each of which has four groups. There’s no mention of the omnibus statistic – the one way analysis of variance that should come first to justify using these pairwise statistics. No statistics professor would [or should] let that pass unnoticed. It’s so common in RCTs that it’s rarely even commented on. I didn’t see it until after my first post was already up, and that was only because the Paxil Study 329 had alerted me to the issue. I let it ride thinking someone might notice, but no one did. If you don’t know what I’m talking about, the next post will explain it, and it’s something worth understanding in my opinion. The easiest way to say it is that I have to prove that I have the justification to do the pairwise analyses.
  • Method I is a whole lot faster. It’s saved to my desktop and when I read an RCT, I’m filling it out on my first pass through the article because it’s so helpful in evaluating what I’m reading. Speed is the reason I made it. Looking up the Internet Calculators, entering the numbers, and then writing the results on the back of an envelope as I go is basically just a lot of trouble.
  • If you use it and want to hold onto the results, save it under another name so as not to damage the underlying formulas. I didn’t protect any cells because I get annoyed when others do that. I invariably want to make some changes, and unprotecting is something of a pain. If it gets messed up, just come back here and reload it.
  • Don’t worry that I’m going to go on and on about all this number/statistics stuff. If you’re not interested, just skip any post that has john henry in the title. I’ll get back to the day to day kvetching about the sorry state of science in psychiatry in a week or so. But I’ve gotten enough email chatter to realize that there are some soul-mates who want to explore these jake-leg ways of vetting the RCTs.
  • Finally, if I get something wrong, don’t hesitate to let me know. I’m learning too. This stuff wasn’t covered in psychoanalytic training either…
Mickey @ 2:01 PM

income switching…

Posted on Monday 4 January 2016

[continued from outcome switching…]

My title is facetious – guilty as charged. What I’m pointing to is that there are more ways to bugger a Clinical Trial Protocol than changing the outcome variables after the study is underway like they did in Paxil Study 329. One way is to change the dataset definition [what comes in]. The double entendre of the word income was just too tempting to resist – ergo income switching. My example is [you guessed it] the recent Clinical Trials of Brexpiprazole in Augmentation in Treatment Resistant Depression. At some point after the trial was underway, they made a Protocol change:
by Thase ME, Youakim JM, Skuban A, Hobart M, Zhang P, McQuade RD, Nyilas M, Carson WH, Sanchez R, and Eriksson H.
Journal of Clinical Psychiatry. 2015 76[9]:1232-1240.

by Thase ME, Youakim JM, Skuban A, Hobart M, Augustine C, Zhang P, McQuade RD, Carson WH, Nyilas M, Sanchez R, and Eriksson H.
Journal of Clinical Psychiatry. 2015 76[9]:1224-31.

Following the prospective treatment phase, patients were eligible for entry into the double-blind randomized treatment phase if they had inadequate prospective ADT response, defined as < 50% reduction in HDRS-17 total score between baseline and end of the prospective phase, with an HDRS-17 total score of ≥ 14 and a Clinical Global Impressions-Improvement scale (CGI-I) score of ≥ 3 at the end of the prospective phase. While this study was ongoing, additional analyses were performed on data from a completed phase 2 study of similar design… It was found that a small number of patients in that study had seemingly adequate improvement in Montgomery-Asberg Depression Rating Scale (MADRS) and CGI-I scores at various times during the prospective treatment period, but subsequent worse scores at time of randomization. These patients did not show a consistent lack of response and would have been considered adequate responders if evaluated at another time point during the prospective phase. A number of these patients showed significant improvement again during the randomized phase, even if continuing on ADT alone…
In the first paper, it continues:
In order to exclude patients with seemingly variable response to ADT, this study’s protocol was amended in March 2012 during the enrollment phase and prior to database lock to specify that patients had to meet more refined inadequate response criteria throughout prospective treatment (HDRS-17 score ≥14, <50% reduction from baseline in HDRS-17 as well as <50% reduction in MADRS total score between start of prospective treatment and each scheduled visit, and CGI-I score ≥3 at each scheduled visit) to be eligible for randomization. The investigator was also blinded to the revised criteria. Both the protocol amendment and the resulting primary analysis were discussed and agreed with the relevant regulatory authorities (US Food and Drug Administration).
Whereas in the second, we read:
In order to exclude patients with seemingly variable response to ADT, this study’s protocol was amended to specify that patients had to meet more refined inadequate response criteria throughout prospective treatment (a HDRS-17 score ≥14; < 50% reduction from baseline in HDRS-17, as well as <50% reduction in MADRS total score between start of prospective treatment and each scheduled visit, and CGI-I score ≥3 at each scheduled visit) to be eligible for randomization and also to blind the investigator to the revised criteria.
First off, I don’t believe that part in red above [the FDA didn’t either]:

7.4. Adjunctive Treatment of MDD

7.4.1. The Sponsor conducted two adequate and well – controlled trials to asse ss the efficacy of brexpiprazole for the adjunctive treatment of MDD. Based on the prespecified statistical analysis plan, only one of these trials (Study 331-10-228) was positive. The Sponsor acknowledges that Study 331-10-227 was not positive based on the pre-specified plan, but provides a number of arguments to support the concept that brexpiprazole should nonetheless be approved for this indication.
While their explanation may read as if they’re just doing their part for science, what they’re proposing is actually absurd. They’re changing their basic definition in midstream in a way that makes their result come out in their favor. That’s simply never okay. As much as people like to describe these industry-funded [and analyzed], ghost-written clinical trials as research, that is [IMO] a misnomer. The proper term is product testing, and high stakes product testing at that. The track record of these corrupted studies speaks for itself. So I propose the following:
The 1boringoldman Manifesto

  1. The a priori Protocol be filed publicly on either clinicaltrials.gov or some other new registry [a-priori-protocols.gov] prior to starting any clinical trial.
  2. Only allowing procedural changes to the Protocol as Amendments if they have no possibility of affecting the outcome or the analysis.
  3. If something "comes up" that was a mistake after the study is underway [defined as one subject taking one pill], too bad. Scrap the trial and start over.
  4. Finally, the links to the clinical trial registry submission, the Protocol [a-priori-protocols.gov], and the name of any CRO involved and their person in charge for the study be included in any and every publication.
Mickey @ 5:22 PM

outcome switching…

Posted on Monday 4 January 2016

In our reanalysis of Paxil Study 329 [Restoring Study 329: efficacy and harms of paroxetine and imipramine in treatment of major depression in adolescence], we challenged the fact that the published paper reached it’s conclusions about efficacy based on an analysis of outcome variables that were not included in the a priori protocol:
There were four outcome variables in the CSR and in the published paper that were not specified in the protocol. These were the only outcome measures reported as significant. They were not included in any version of the protocol as amendments [despite other amendments], nor were they submitted to the institutional review board. The CSR … states they were part of an “analysis plan” developed some two months before the blinding was broken. No such plan appears in the CSR, and we have no contemporaneous documentation of that claim, despite having repeatedly requested it from GSK…

… although investigators can explore the data however they want, additional outcome variables outside those in the protocol cannot be legitimately declared once the study is underway, except as “exploratory variables”—appropriate for the discussion or as material for further study but not for the main analysis. The a priori protocol and blinding are the bedrock of a randomised controlled trial, guaranteeing that there is not even the possibility of the HARK phenomenon [“hypothesis after results known”]
Their claim was that these variables were declared before the blind was broken, ergo they were a priori. We had no evidence that was true, but even if it had been, we would’ve challenged using those variables anyway. When billions of dollars in commercial profit are on the line, taking a claim like that on faith is irrational. We couldn’t prove they "peeked" along the way, but the burden of proof is on their shoulders, not ours. The only guarantee that the final analysis is not jury-rigged is to insist on the analysis as declared in the a priori protocol. But what if they made a mistake in the protocol? Too bad. Do another trial. The whole point of an a priori protocol is to eliminate even the possibility of outcome switching [as it has come  to be called]:
Vox: Science and Health
by Julia Belluz
December 29, 2015

For years, the drug company GlaxoSmithKline illegally marketed paroxetine, sold under the brand name Paxil, as an antidepressant for children and teenagers. It did so by citing what’s known as Study 329 — research that was funded by the drug company and published in 2001, claiming to show that Paxil is "well tolerated and effective" for kids. That marketing effort worked. In 2002 alone, doctors wrote 2 million Paxil prescriptions for children and adolescents. Years later, after researchers reanalyzed the raw data behind Study 329, it became clear that the study’s original conclusions were wildly wrong. Not only is Paxil ineffective, working no better than placebo, but it can actually have serious side effects, including self-injury and suicide.

So how did the researchers behind the trial manage to dupe doctors and the public for so long? In part, the study was a notorious example of what’s called "outcome switching" in medical research. Before researchers start clinical trials, they’re supposed to pre-specify which health outcomes they’re most interested in…

… "In Study 329," explains Ben Goldacre, a crusading British physician and author, "none of the pre-specified analyses yielded a positive result for GSK’s drug, but a few of the additional outcomes that were measured did, and those were reported in the academic paper on the trial, while the pre-specified outcomes were dropped."

These days, it’s easy to see whether researchers are engaged in outcome switching because we now have public clinical trials registries where they’re supposed to report their pre-specified outcomes before a trial begins. In theory, when journals are considering a study manuscript, they should check to see whether the authors were actually reporting on those pre-specified outcomes. But even still, says Goldacre, this isn’t always happening.

So with his new endeavor the Compare Project, Goldacre and a team of medical students are trying to address the problem. They compare each new published clinical trial in the top medical journals with the trial’s registry entry. When they detect outcome switching, they write a letter to the academic journal pointing out the discrepancy, and then they track how journals respond. I spoke to Goldacre to learn more.

"When we get the wrong answer, in medicine, that’s not a matter of academic sophistry — it causes avoidable suffering"

Julia Belluz: Why does outcome switching matter?

Ben Goldacre: This is an interesting example of a nerdy problem whose importance requires a few pages of background knowledge, and that’s probably why it’s been left unfixed for so long. But in short: Switching your outcomes breaks the assumptions in your statistical tests. It allows the "noise" or "random error" in your data to exaggerate your results [or even yield an outright false positive, showing a treatment to be superior when in reality it’s not].

We do trials specifically to detect very modest differences between one treatment and another. You don’t need to do a randomized trial on whether a parachute will save your life when you jump out of an airplane, because the difference in survival is so dramatic. But you do need a trial to spot the tiny difference between one medical intervention and another. When we get the wrong answer, in medicine, that’s not a matter of academic sophistry — it causes avoidable suffering, bereavement, and death. So it’s worth being as close to perfect as we can possibly be…

First off, three cheers for Ben Goldacre’s Compare Project! I’m glad to see our Paxil Study 329 findings put into general use in this regard. Of course I didn’t believe the GSK explanation for outcome switching in that study the first time I read it, but the RIAT Initiative wasn’t intended to be a critique or an indictment – rather an accurate republication. So we didn’t rest our argument on inuendo or inference – we stuck to the facts. I would recommend Ben’s army do the same. And Godspeed! I wrote them and suggested they include any protocol change in their project, including Income Switching [see the next post]…
Mickey @ 3:36 PM

in the land of sometimes[5]

Posted on Sunday 3 January 2016

This figure is obviously adapted from the last post [oh well…]. It’s the strength of effect [Standardized Mean Difference AKA Cohen’s d AKA ~Hedges g] of the Atypical Antipsychotics [in black] in the treatment of Schizophrenia with the values for Brexpiperazole  added below [in green]. The  upper values are from thousands of patients compiled in a meta-analysis and the Brexpiperazole values are from a few hundred in two recent RCTs [see the spice must flow…]. In an earlier version of this figure, I hadn’t put in the 95% Confidence Limits [because I didn’t know how]. The diamond at the bottom is the weighted mean for the Brexpiprazole values [SMD = -0.28].

While the practice of using p·values as a gold standard continues in our psychiatry journals, that’s not the case throughout the scientific world. To make the point for the thousandth time, all a p·value tells you is that two populations differ, but not by how much. Statistical separation can vary from trivial to meaningful, and the p·value doesn’t reveal anything about that variability. So the American Psychological Association recommends that the Effect Size with its 95% Confidence Intervals be universally reported [and many of their journals won’t publish articles that don’t include them]. The Effect Size not only adds the dimension of the magnitude of an effect, in many cases, it can be used for comparisons between studies.

Though the Effect Size adds a quantitative dimension to the RCT analysis over the qualitative p·value, it’s no gold standard either. Note the width of the 95% Confidence Intervals in the Brexpiprazole data. Is that because these are individual RCTs rather than pooled studies with much larger groups? Is it because these are CRO-run studies spread over [too] many sites [60 each!]? We don’t know that. All we really know is that it sure is a wide interval, apparent also in the standard deviation values [σ]:

BREXPIPRAZOLE Trials in Schizophrenia


STUDY DRUG MEAN SEM σ n p d lower upper
Correll et al placebo -12.01 1.60 21.35 178
0.25mg -14.90 2.23 20.80 87 0.3 0.14 -0.120 0.393
2mg -20.73 1.55 20.80 180 <0.0001 0.41 0.204 0.623
4mg -19.65 1.54 20.55 178 0.0006 0.36 0.155 0.574
Kane et al placebo -13.53 1.52 20.39 180
1mg -16.90 1.86 20.12 117 0.1588 0.166 -0.067 0.399
2mg -16.61 1.49 19.93 179 0.1488 0.153 -0.054 0.360
4mg -20.00 1.48 13.45 181 0.0022 0.321 0.113 0.529
[values in red calculated by yours truly – not in the paper]

A thing of beauty, this little table. It doesn’t answer all the questions, but it gives you all the information you need to think about things in an informed way. The Effect Size [d] values and their 95% Confidence Intervals are a decided plus. In a way, these two articles are exemplary. The papers themselves tell you that it is an industry funded, ghost written article. All the information in the table is either in the paper or easily calculated [in red]. Add the information on clinicaltrials.gov, and you are in a position to make informed decisions about what these two studies have to say about the efficacy of Brezpiprazole. And now to the point of this post. These papers represent progress. While it’s not Data Transparency proper, it’s close enough for everyday work. But this is the exception to the rule, to be able to make that table with a minimal expenditure of energy.

These two papers are not available on line, and the abstracts in PubMed don’t have enough information to construct the table. So you have to have access to the papers. If your retirement hobby is trying to evaluate these RCTs of psychiatric drugs, you already know that in the majority of papers, it isn’t possible to make that table this easily, if at all. Though all you really need is the MEAN, the number of subjects, and either the SEM [Standard Error of the Mean] or the Standard Deviation for each group – and you’re good to go. But invariably, they’re not available. The results are frequently reported in some other way, and one gets the feeling that it’s by design – a bit of subterfuge. But whether that conclusion is an acquired paranoia on my part or the truth doesn’t matter. What matters is that you can’t do what’s needed to understand the efficacy results and to compare them with other studies.

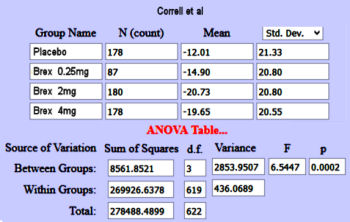
This is the stuff of premature hair loss and nervous twitches in the brave souls who do meta-analyses. And they’ve responded by finding ways to gather the needed information to produce tables like this one. Their methodology is buried in big thick books like the Cochrane Handbook for Systemic Reviews of Interventions or expensive software like the Comprehensive Meta-Analysis software. This is hardly the stuff for your basic hobby blogger like me. Fortunately, there are all kinds of formulas and Internet calculators scattered around that allow one to get the job done. So the next one of these in the land of sometimes… posts will likely be a short catalog of these tools [for we mortals] for exhuming the information that should’ve been provided by the authors/writers in the first place. Boring? yes. Necessary? also yes. The alternative is tantamount to drinking the Kool-ade.
hat tip to Glen Spielmans and other teachers… 
Mickey @ 12:15 PM

oh well…

Posted on Friday 1 January 2016

So there’s an article that I’ve looked up over and over. I referred to it a lot looking into Brexpiprazole. It compares the strength of effect of various parameters for the Atypical Antipsychotics. I thought it was a shame it wasn’t open access, so I went after its forest plots with my graphics program and removed all but the bare bones [including the drugs not available in the US]. After I got through, I went to post it and found that there was a pdf available on-line after all. Oh well. My summary graphic is below anyway…
by Stefan Leucht, Andrea Cipriani, Loukia Spineli, Dimitris Mavridis, Deniz Örey, Franziska Richter, Myrto Samara, Corrado Barbui, Rolf R Engel, John R Geddes, Werner Kissling, Marko Paul Stapf, Bettina Lässig, Georgia Salanti, and John M Davis
The Lancet. 2013 382:951-962.

Background The question of which antipsychotic drug should be preferred for the treatment of schizophrenia is controversial, and conventional pairwise meta-analyses cannot provide a hierarchy based on the randomised evidence. We aimed to integrate the available evidence to create hierarchies of the comparative efficacy, risk of all-cause discontinuation, and major side-effects of antipsychotic drugs.
Methods We did a Bayesian-framework, multiple-treatments meta-analysis [which uses both direct and indirect comparisons] of randomised controlled trials to compare 15 antipsychotic drugs and placebo in the acute treatment of schizophrenia. We searched the Cochrane Schizophrenia Group’s specialised register, Medline, Embase, the Cochrane Central Register of Controlled Trials, and ClinicalTrials.gov for reports published up to Sept 1, 2012. Search results were supplemented by reports from the US Food and Drug Administration website and by data requested from pharmaceutical companies. Blinded, randomised controlled trials of patients with schizophrenia or related disorders were eligible. We excluded trials done in patients with predominant negative symptoms, concomitant medical illness, or treatment resistance, and those done in stable patients. Data for seven outcomes were independently extracted by two reviewers. The primary outcome was efficacy, as measured by mean overall change in symptoms. We also examined all-cause discontinuation, weight gain, extrapyramidal side-effects, prolactin increase, QTc prolongation, and sedation.
Findings We identifi ed 212 suitable trials, with data for 43 049 participants. All drugs were significantly more effective than placebo. The standardised mean differences with 95% credible intervals were: clozapine 0·88, 0·73–1·03; amisulpride 0·66, 0·53–0·78; olanzapine 0·59, 0·53–0·65; risperidone 0·56, 0·50–0·63; paliperidone 0·50, 0·39–0·60; zotepine 0·49, 0·31–0·66; haloperidol 0·45, 0·39–0·51; quetiapine 0·44, 0·35–0·52; aripiprazole 0·43, 0·34–0·52; sertindole 0·39, 0·26–0·52; ziprasidone 0·39, 0·30–0·49; chlorpromazine 0·38, 0·23–0·54; asenapine 0·38, 0·25–0·51; lurasidone 0·33, 0·21–0·45; and iloperidone 0·33, 0·22–0·43. Odds ratios compared with placebo for all-cause discontinuation ranged from 0·43 for the best drug [amisulpride] to 0·80 for the worst drug [haloperidol]; for extrapyramidal side-eff ects 0·30 [clozapine] to 4·76 [haloperidol]; and for sedation 1·42 [amisulpride] to 8·82 [clozapine]. Standardised mean differences compared with placebo for weight gain varied from –0·09 for the best drug [haloperidol] to –0·74 for the worst drug [olanzapine], for prolactin increase 0·22 [aripiprazole] to –1·30 [paliperidone], and for QTc prolongation 0·10 [lurasidone] to –0·90 [sertindole]. Efficacy outcomes did not change substantially after removal of placebo or haloperidol groups, or when dose, percentage of withdrawals, extent of blinding, pharmaceutical industry sponsorship, study duration, chronicity, and year of publication were accounted for in meta-regressions and sensitivity analyses.
Interpretation Antipsychotics differed substantially in side-effects, and small but robust diff erences were seen in effi cacy. Our findings challenge the straightforward classification of antipsychotics into first-generation and second- generation groupings. Rather, hierarchies in the different domains should help clinicians to adapt the choice of antipsychotic drug to the needs of individual patients. These findings should be considered by mental health policy makers and in the revision of clinical practice guidelines.
Funding None
Mickey @ 8:04 PM